


Wednesday’s P&F evidence showed a broader expansion of supply across the U.S. market, but the deterioration was not uniform.
Fresh signals: 24 new Double Top breakouts versus 73 new Double Bottom breakdowns — a net −49, compared with −8 on Sept. 22.
Breadth pressure: Energy Bullish Percent Index (BPI) fell below 50 and Health Care BPI declined to 49.2.
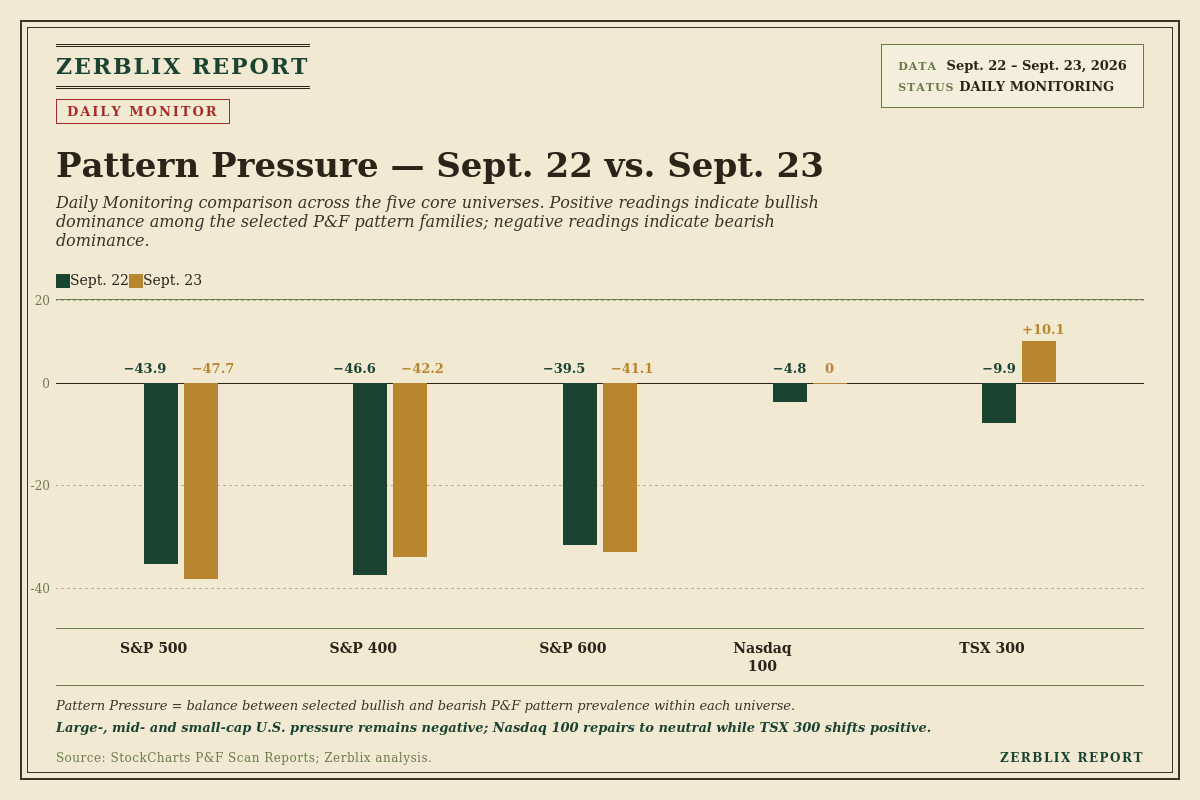
Divergence: Technology BPI held at 57.8, Nasdaq 100 Pattern Pressure recovered to neutral, and TSX 300 Pattern Pressure moved to the bullish side.
Structure
Fresh downside P&F signals expanded sharply during Wednesday’s session. The increase in Double Bottom breakdowns, accompanied by fewer new Double Top breakouts, shows that a larger number of stocks were giving way to supply than were overcoming previous columns of Xs to establish new upside signals.
The broader pattern structure remained under pressure. S&P 500 Pattern Pressure declined from −43.9 to −47.7, while the S&P 600 slipped from −39.5 to −41.1. The S&P 400 improved to −42.2, but its pattern balance remained decisively negative.
The principal exceptions were the Nasdaq 100, which repaired from −4.8 to neutral, and the TSX 300, which moved from −9.9 to +10.1.
Supply and Demand
The combination of heavier fresh downside issuance and weakening broad-market BPI indicates that supply continued to gain ground across much of the U.S. equity population.
Energy showed one of the clearest losses of participation. Its BPI declined to 47.6, moving below the 50% level after standing above 70% at the latest Official Friday benchmark. Health Care also weakened materially, falling 8.5 points during Wednesday’s session to 49.2.
These readings do not describe new signals alone. The Bullish Percent Index (BPI) measures the proportion of stocks carrying active P&F buy signals. A declining reading therefore indicates that bullish participation is contracting as supply gains control in a larger portion of the group. The direction of the indicator, together with its position within the broader range, provides the more useful measure of underlying participation.direction and level of the reading carrying the larger significance.
Divergence
Technology did not confirm the same degree of deterioration. Its BPI held at 57.8, while Nasdaq 100 Pattern Pressure returned to equilibrium. Canada also separated from the U.S. picture as TSX 300 Pattern Pressure crossed into positive territory.
That divergence is important. The broad U.S. market is still showing a negative balance between bullish and bearish P&F structures, but the pressure is not being distributed evenly. Technology and Canadian equities are showing comparatively firmer demand while large-, mid- and small-cap U.S. participation remains under heavier supply.
What Matters Next
The bearish interpretation would strengthen if fresh Double Bottom breakdowns continue to dominate, broad-market BPI contracts further, and negative Pattern Pressure persists across the S&P 500, S&P 400 and S&P 600.
The interpretation would begin to weaken if fresh upside signals recover, the current downside imbalance narrows, and the weaker BPI groups begin to reclaim lost participation. Continued strength in Technology and further positive development in the Nasdaq 100 and TSX 300 would reinforce the present divergence rather than confirm a uniform market decline.
Practical interpretation: broad U.S. participation weakened Wednesday, but the evidence does not yet describe a market in which all groups are deteriorating together. The developing question into Friday is whether Technology and Canada can continue to resist the broader supply pressure, or whether the weakness begins to spread into those areas as well.
Daily Monitoring observations are provisional. Friday remains the authoritative Zerblix weekly benchmark.
Daily Monitoring is provisional and reflects end-of-day breadth and P&F evidence. Friday remains the authoritative Zerblix weekly benchmark. For informational and educational purposes only; not investment advice.