


Technology produced a concentrated group of new point-and-figure upside signals today, especially among semiconductors. Across the broader US scan, however, new downside signals were far more numerous. Friday will test whether that pocket of demand can hold while participation elsewhere weakens.
Verified Evidence Table
Fresh US breakouts: 35; 22 in Technology, including 11 semiconductors.
Fresh US breakdowns: 93.
S&P 500 Bullish Percent: 31.40%, down 2.80 points.
NYSE Bullish Percent: 35.13%, down 2.01 points.
Technology Bullish Percent: 54.93%, up 4.23 points.
Materials Bullish Percent: 15.38%, down 11.54 points.
Industrials Bullish Percent: 24.05%, down 6.33 points.
Cross-Asset Leaders
An October 1 ETF return snapshot has not been supplied, so the cross-asset leader remains unclassified. Technology’s P&F breadth improved, but that does not establish how stocks performed against bonds, commodities, or currencies.
Cross-Asset Laggards
The cross-asset laggard also remains unclassified. Weak P&F participation is a structural reading, not a daily ETF return.
Sector/Industry Divergences
Technology accounted for 22 of the 35 fresh US breakouts, including 11 semiconductor names. Its Bullish Percent rose from 50.70% on September 30 to 54.93% on October 1. Telecom Services also rose, from 43.59% to 46.15%.
Supply was broader. Industrials recorded 22 fresh breakdowns against four breakouts; Health Care 15 against two; Consumer Discretionary 13 against four; Materials 10 against one; and Financials nine against one. Materials’ Bullish Percent fell from 26.92% to 15.38%, Industrials from 30.38% to 24.05%, and Energy from 47.62% to 38.10%.
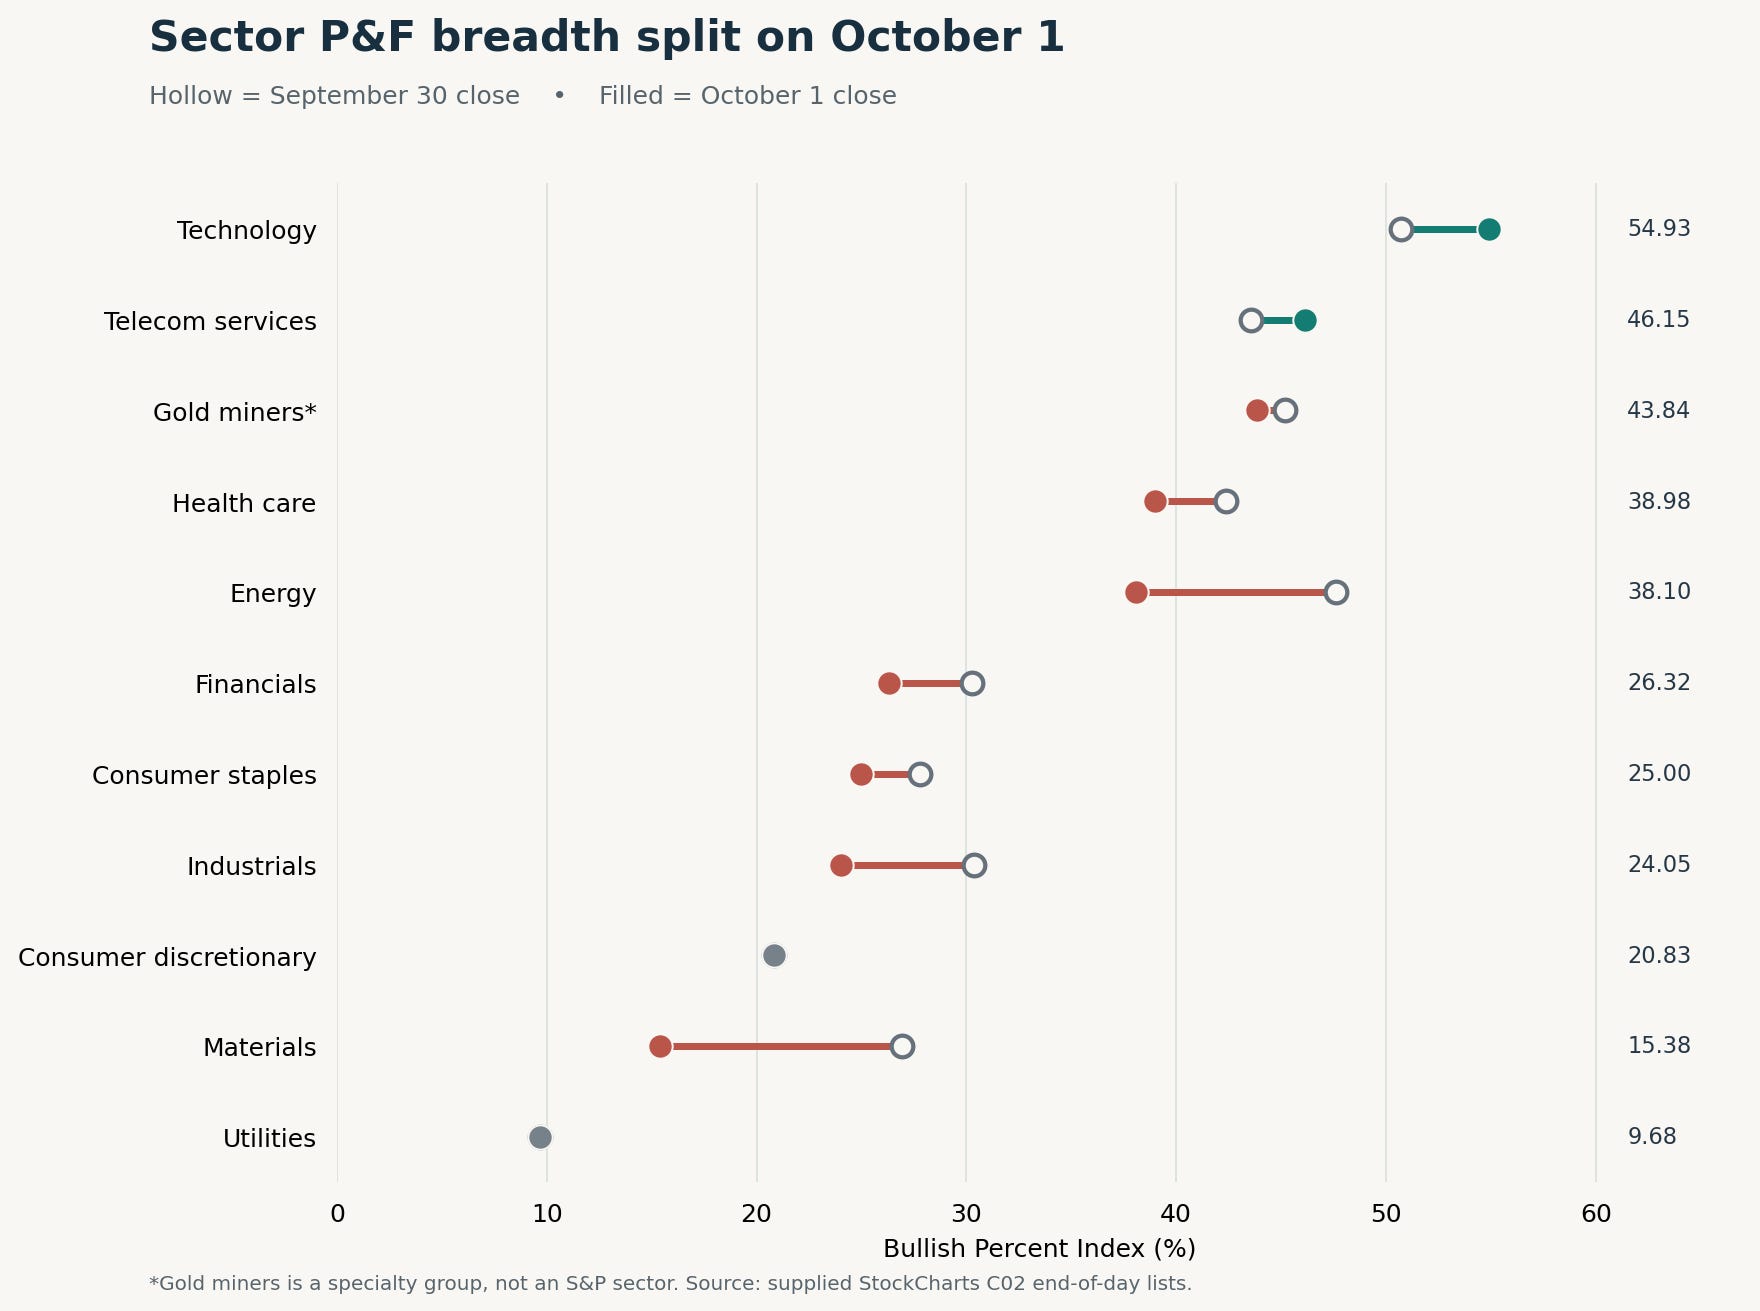
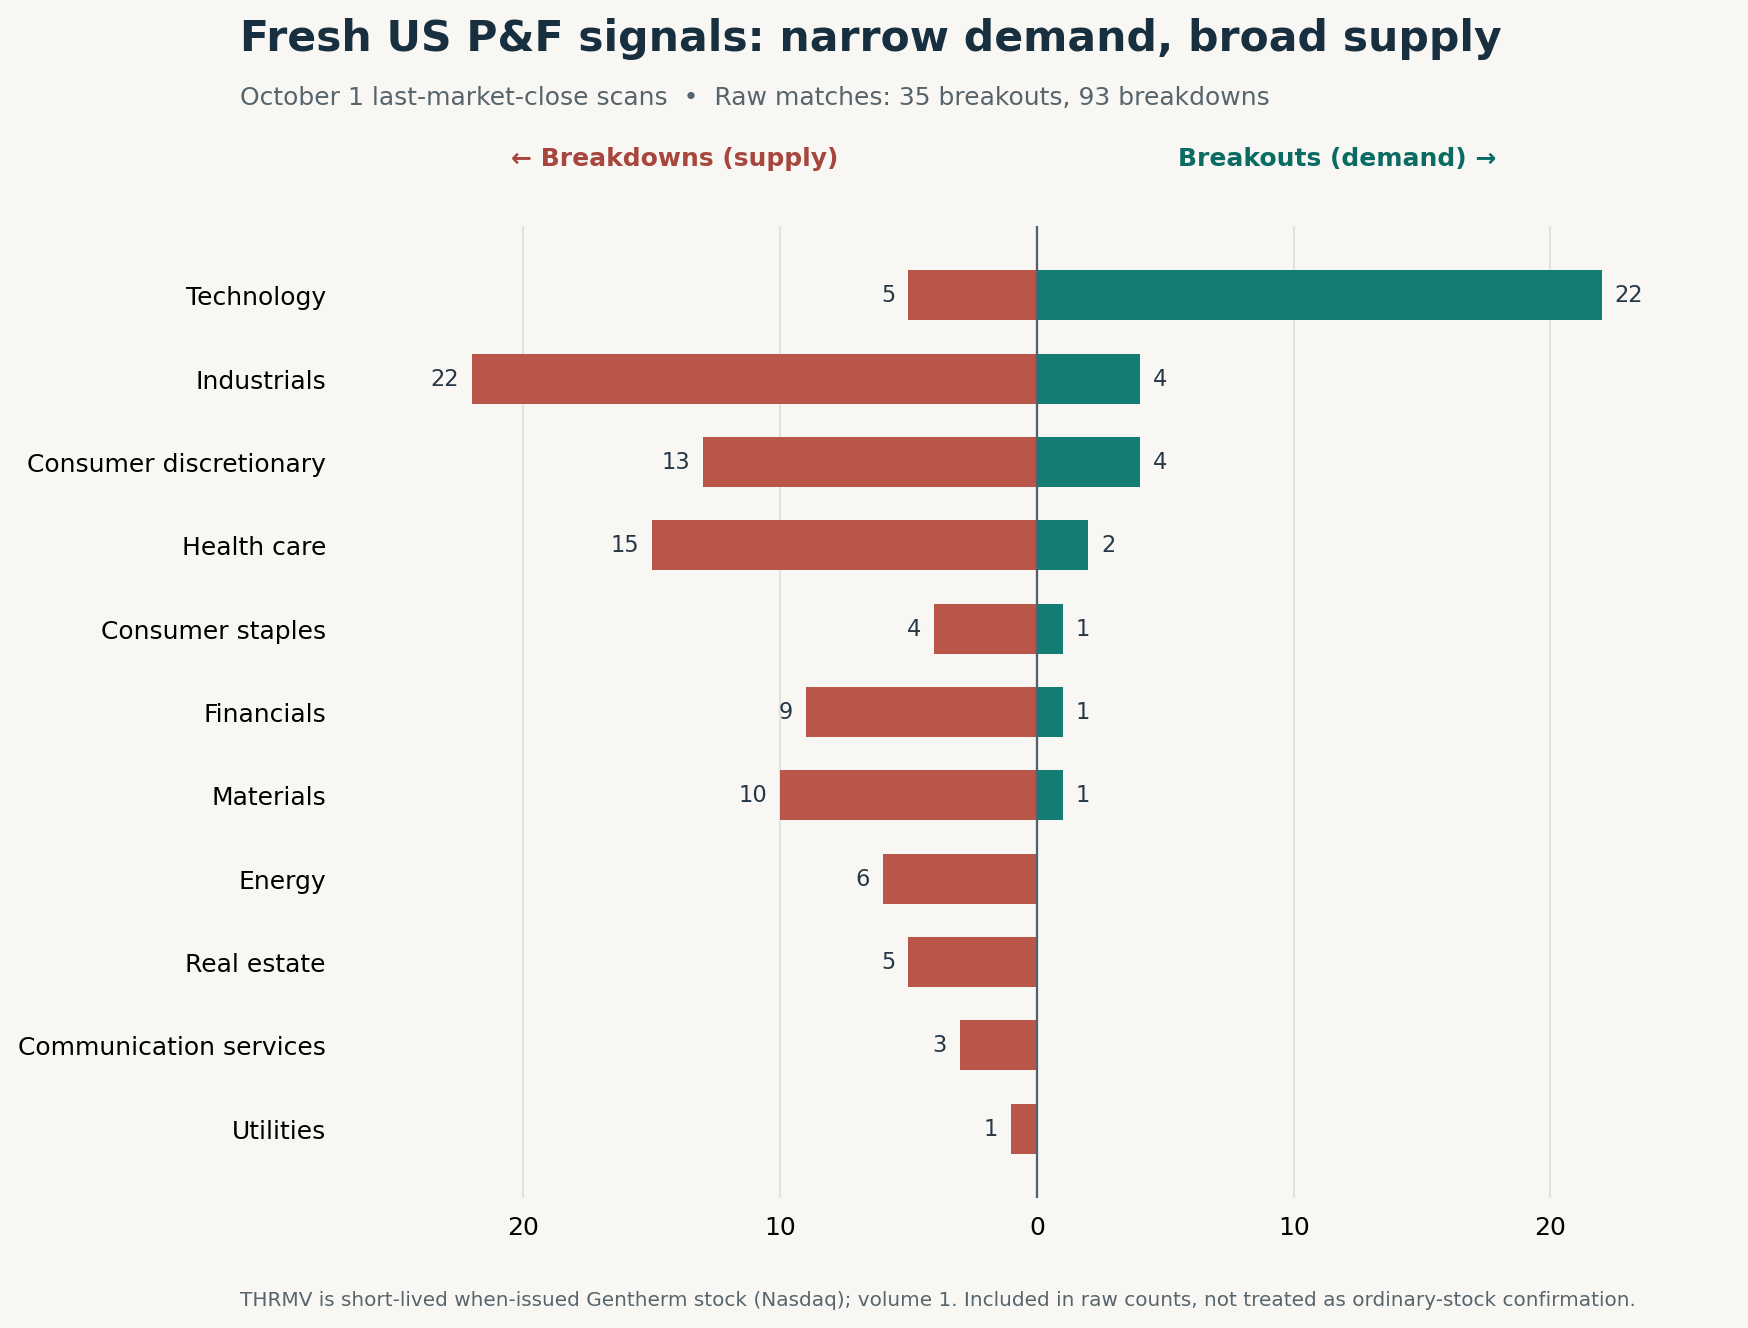
The distinction matters. Fresh scans show where new signals appeared today; Bullish Percent shows how P&F buy signals are distributed within a group. Together, they describe selective demand within broader supply, without settling the intermediate Zerblix outlook.
International/Intermarket Observations
The TSX Composite Bullish Percent closed at 48.37%, down 2.33 points. The established TSX 300 pattern scan showed 28 double top breakouts versus 62 double bottom breakdowns. Canadian P&F participation warrants attention, but the supplied data do not rank Canadian ETF returns against other markets.
Items Worth Watching Into Friday
Friday’s Official Zerblix evidence will test whether semiconductor breakouts survive, whether Technology’s participation continues to separate from S&P 500 and NYSE breadth, and whether breakdowns across Industrials, Health Care, Materials, and Financials persist. An October 1 ETF snapshot would show whether price leadership agrees with this P&F divergence. Until then, this is a provisional Daily Monitoring observation.