



Energy and broad commodities retained leadership during the week, while precious metals weakened and participation shifted beneath the major equity benchmarks. Small caps showed an improvement in rising Point & Figure columns, even as Nasdaq-100 participation contracted.
The evidence describes selective demand rather than uniform market strength. Energy showed agreement across commodity exposure, related equity ETFs and Friday’s fresh-stock candidates. Other groups presented a less consistent picture.
Financial stress remained below its historical average, providing useful background. That subdued reading does not resolve the disagreements within equity breadth.
The verified weekly evidence
The comparisons below use October 16 → October 23 Friday endpoints. Breadth changes are expressed in percentage points (pp).
Stocks in rising Point and Figure (P&F) X columns
S&P 500: 71.60% → 62.80% — down 8.80 pp
Nasdaq-100: 60.00% → 48.00% — down 12.00 pp
S&P 400 MidCap: 61.50% → 53.25% — down 8.25 pp
S&P 600 SmallCap: 48.33% → 53.83% — up 5.50 pp
TSX 300: 31.00% → 31.33% — up 0.33 pp
Stocks retaining P&F buy signals
S&P 500 Bullish Percent Index: 44.60% → 50.20% — up 5.60 pp
The distinction matters: X-column participation measures current rising-column direction. Bullish Percent Index (BPI) measures the proportion of stocks retaining active buy signals. A stock can reverse into Os while retaining a buy signal, or rise in Xs while retaining a sell signal.
Energy leadership extends across related exposures
Energy provided the clearest connection between commodity strength and the businesses associated with it. XLE advanced 1.60% during the week, while DBC gained 1.07%.
The intermediate price comparison supports that leadership. Over the 13 weeks ending October 23:
XLE: +16.29%
DBC: +13.29%
XLV: +10.28%
SPY: +2.85%
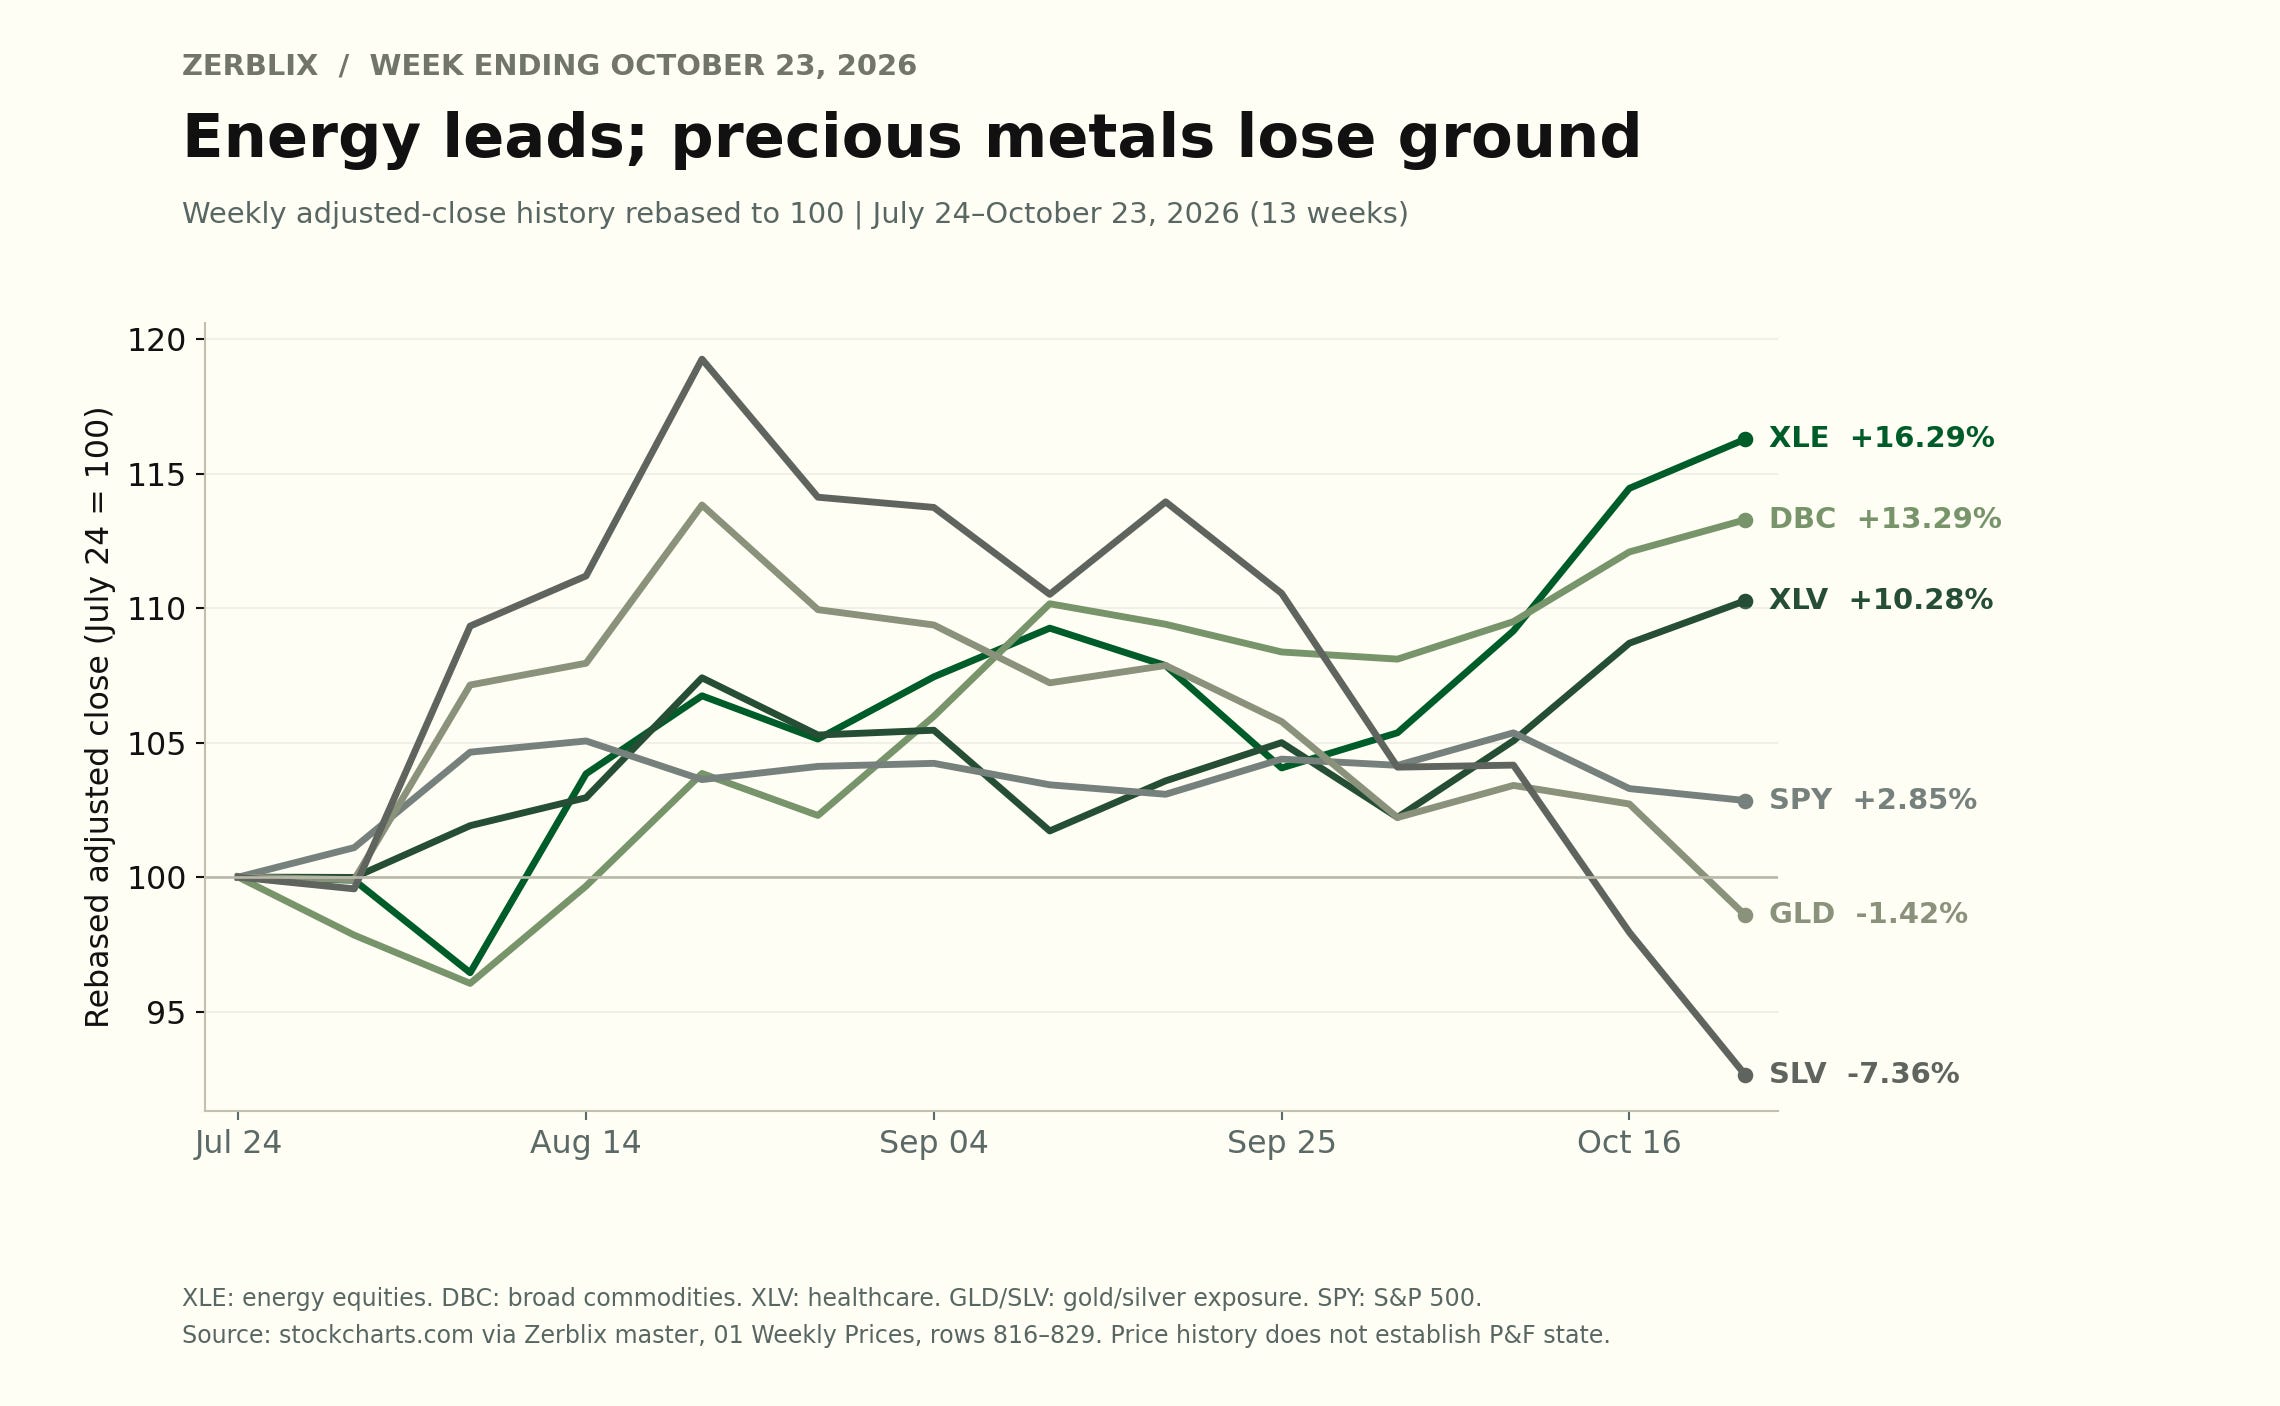
DBC ETF appeared in both the 52-week and three-month leader screens. These screens combine a new price high with an existing bullish P&F Double Top condition. They do not require the Point and Figure Chart (P&F) signal to have formed that session.
The broader ETF leadership screen also included oil exposure through BNO, DBO and USO, together with energy-equity exposure through IXC, IYE, VDE and XLE. These overlapping funds identify concentration within a common theme rather than separate votes for broad market strength.
Friday’s stock scans added supporting evidence. Energy supplied 10 fresh bullish US candidates and no fresh bearish candidates. In Canada, the two fresh bullish candidates—PSK.TO and VET.TO—also came from energy.
The supply-and-demand interpretation is constructive for the group: buying pressure appeared across commodity exposure, related equities and selected stocks. Further confirmation requires those signals to survive and produce follow-through. Failed breakouts or expanding weakness among related businesses would weaken the interpretation.
Commodity strength remains uneven
Energy leadership did not extend uniformly across the commodity complex.
GLD declined 4.03% during the week, while SLV fell 5.42%. Both appeared in the three-month weakness screen, which combines a new price low with an existing bearish P&F condition.
The eligible broad ETF weakness results also included copper miners, lithium, rare earths and uranium-related exposures. The research implication is to examine the individual commodity branches rather than treat resources as one advancing group.
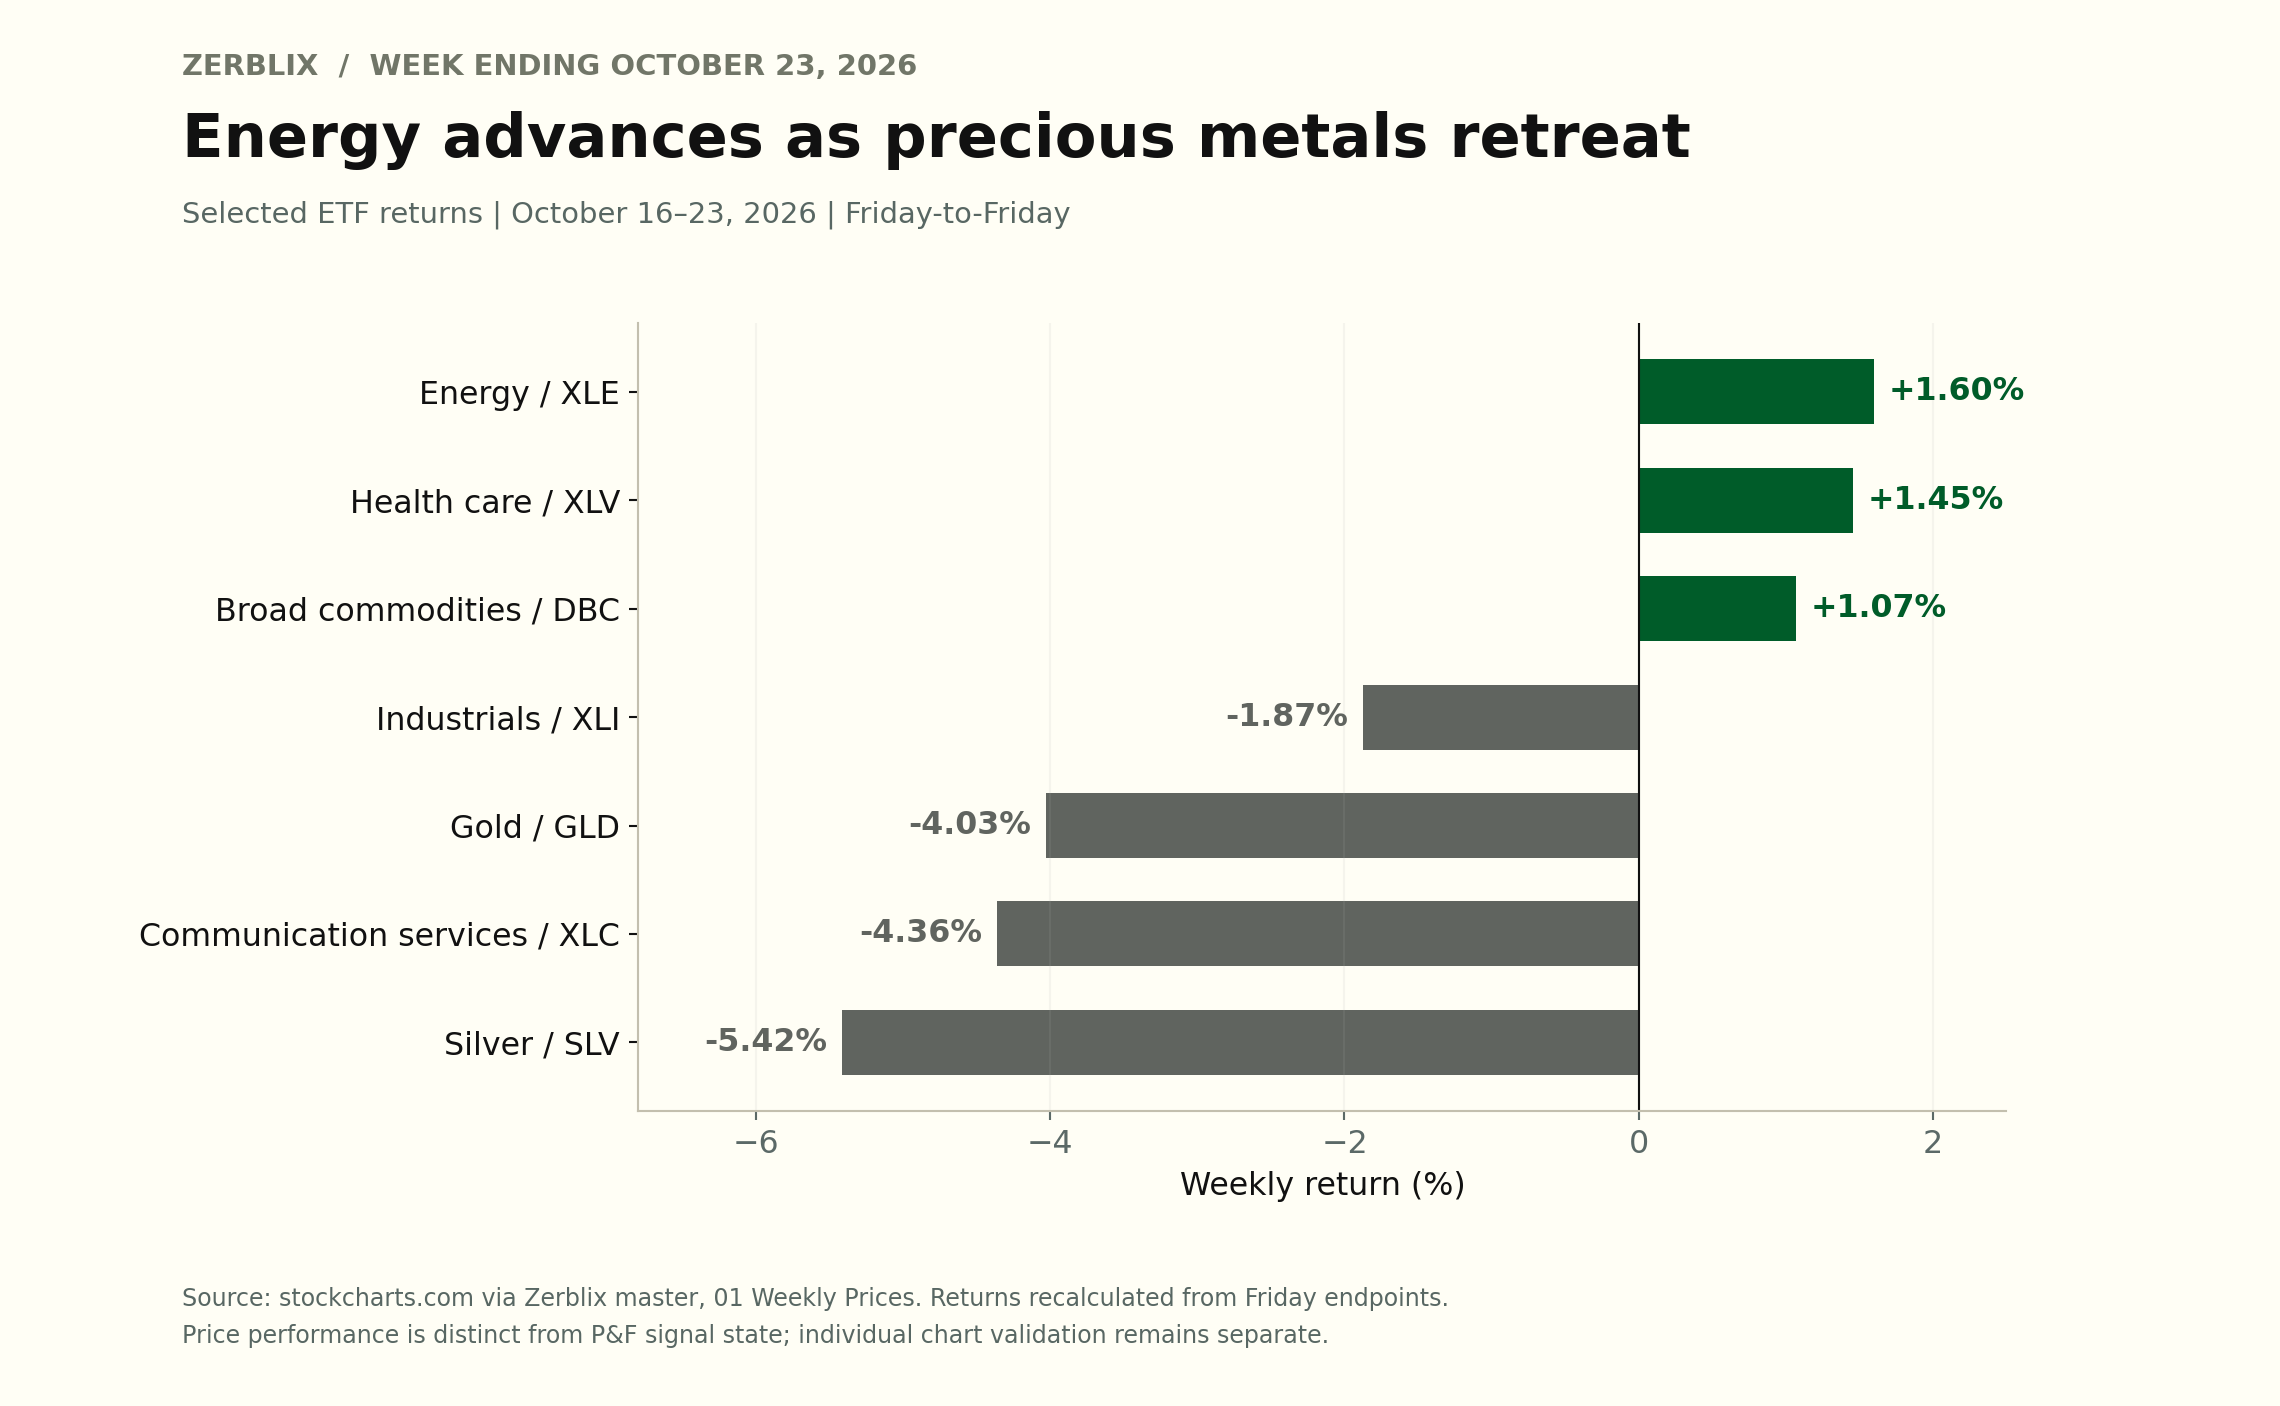
Oil and energy strength can coexist with metals weakness. Continued leadership would be more persuasive if related energy equities maintain their strength while other resource groups begin to stabilize.
Small-cap participation improves as Nasdaq participation contracts
The S&P 600 moved against the broader participation trend. Its share of stocks in rising Point and Figure (P&F) X columns increased 5.50 percentage points to 53.83%.
By comparison, Nasdaq-100 participation fell 12.00 percentage points to 48.00%. Rising-column participation also contracted in the S&P 500 and S&P 400.
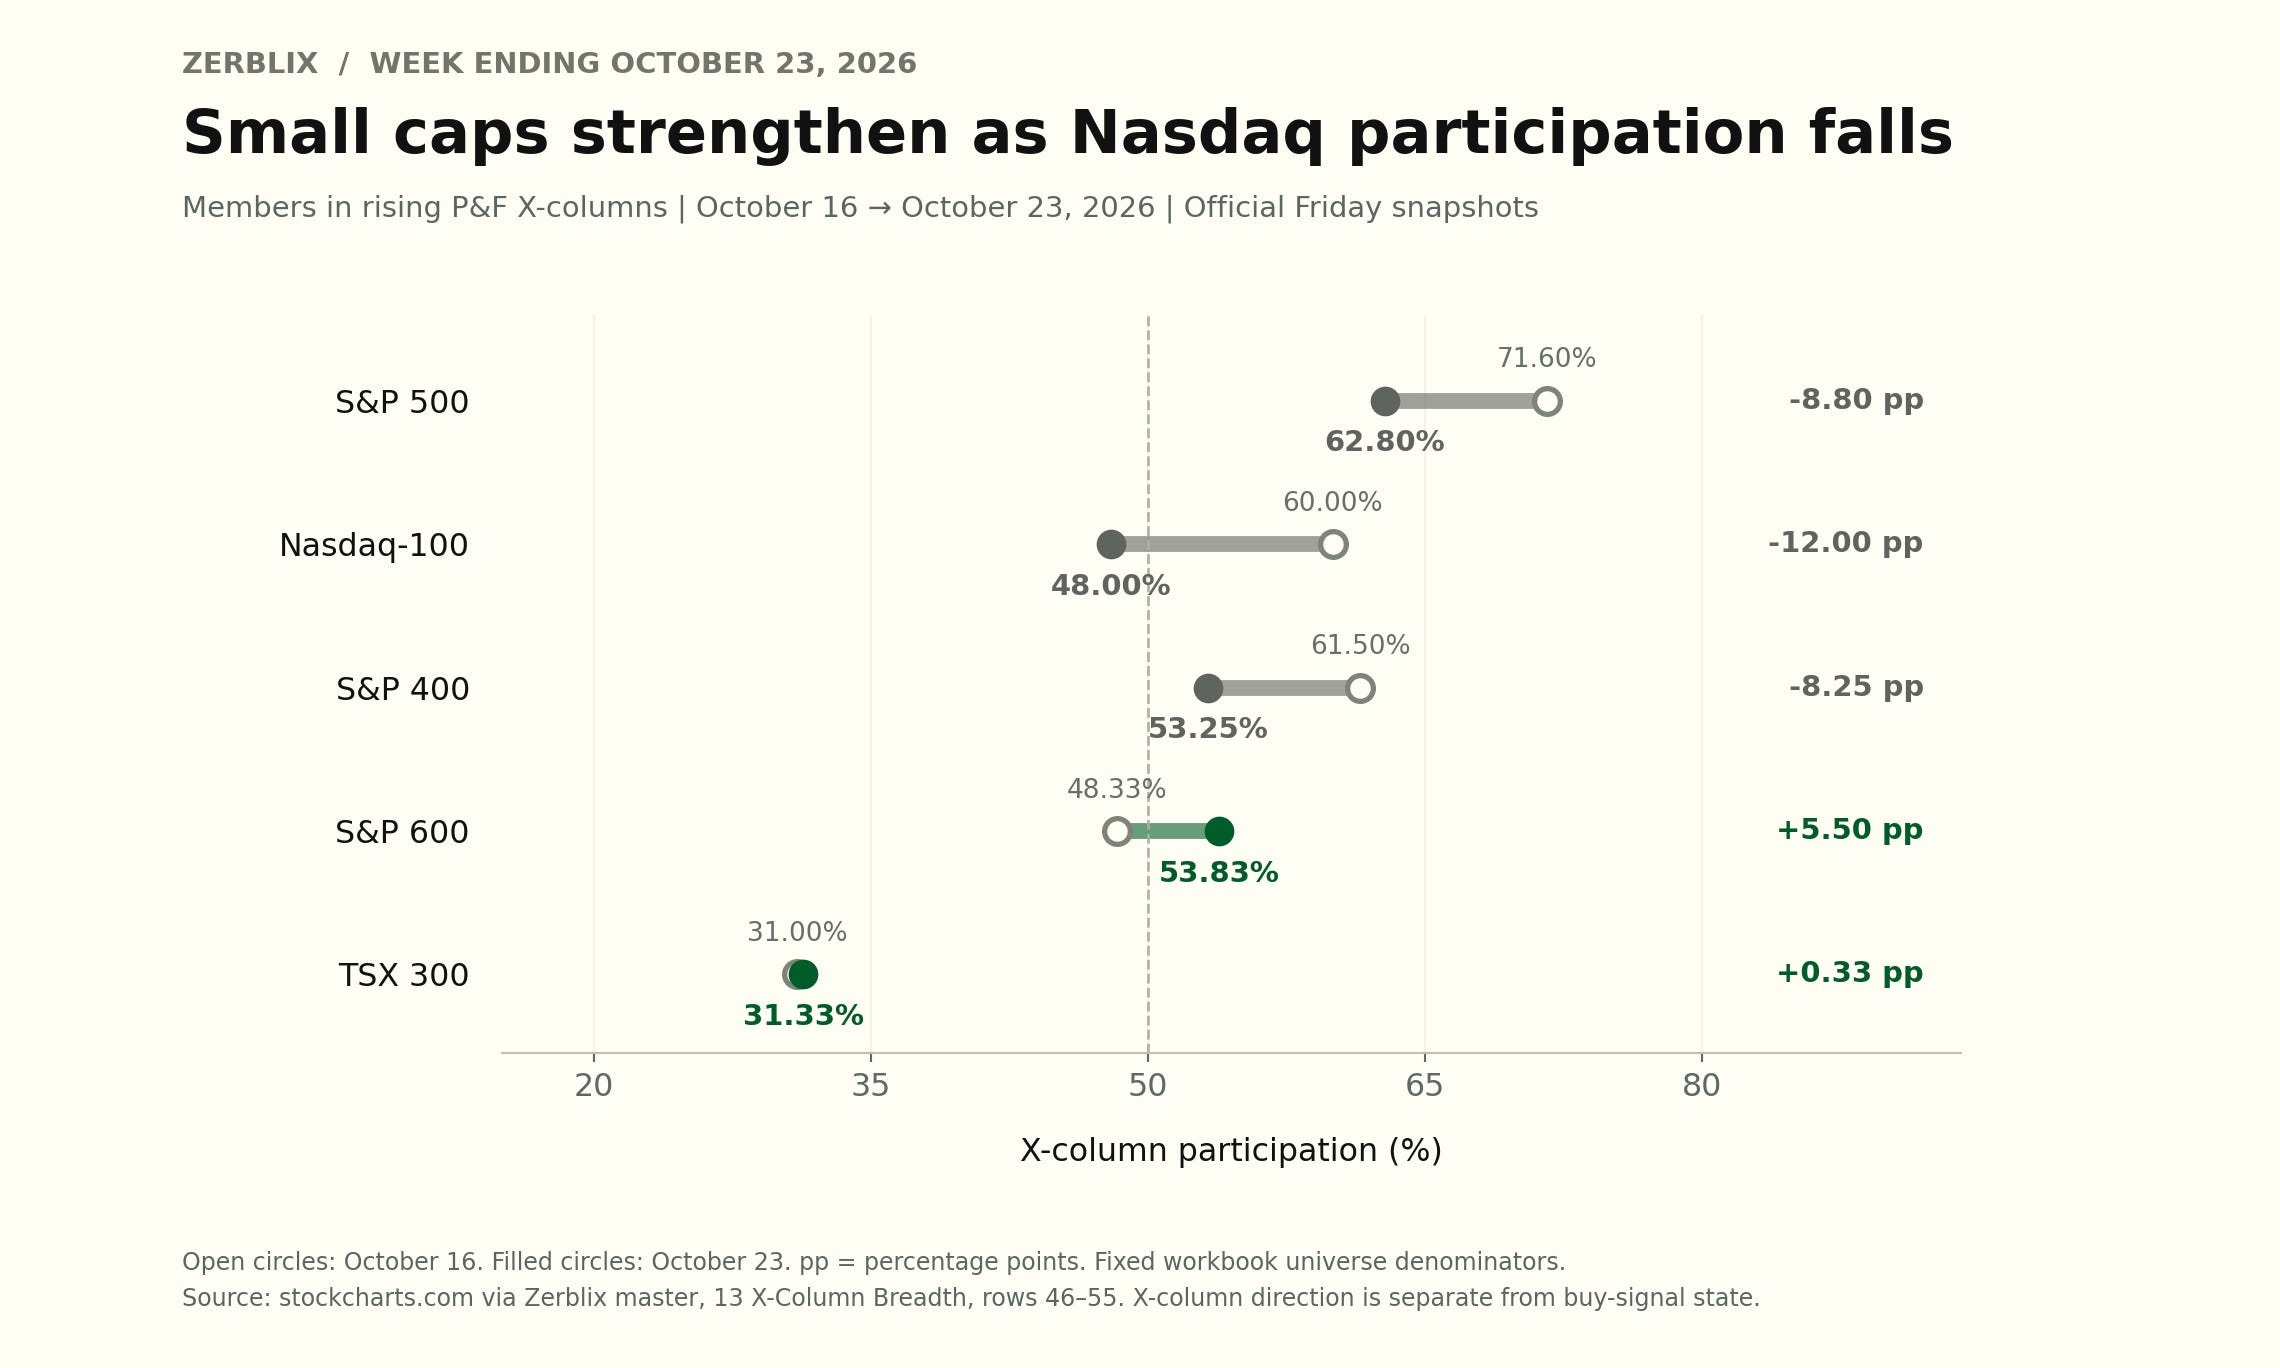
Price supplied related support for the small-cap improvement. IWM gained 1.96% during the week, although it remained down 5.30% over 13 weeks. IWM tracks a different small-cap universe from the S&P 600, so this is supporting price context rather than an exact breadth confirmation.
The combination describes a developing recovery within a weaker intermediate price trend. Sustained participation gains and relative-price improvement would strengthen the case for more durable leadership.
Equal-weight performance also supported the rotation theme. RSP gained 1.14%, while SPY declined 0.43% during the week. Performance was stronger away from the largest index weights, even though overall S&P 500 rising-column participation fell.
More buy signals do not mean every stock is advancing
The S&P 500 BPI increased from 44.60% to 50.20%, while its X-column participation declined.
These readings can occur together. Bullish Percent Index (BPI) measures the proportion of stocks retaining active P&F buy signals. X-column participation measures how many stocks currently occupy rising columns.
A stock can reverse into Os while retaining a buy signal. It can also rise in Xs while retaining a sell signal.
The Nasdaq-100 showed a similar disagreement: its BPI increased from 41.58% to 42.57%, despite the contraction in rising columns. Signal state improved modestly between Friday snapshots, while current direction weakened.
Follow-through would be more convincing if rising-column participation recovers while the expanding buy-signal base holds.
Friday’s fresh signals reveal selective buying and selling
Friday’s US scans produced 32 fresh bullish candidates against 45 fresh bearish candidates.
Energy dominated the bullish side. Consumer discretionary and industrials supplied the largest bearish counts:
Energy: 10 bullish, no bearish candidates.
Consumer discretionary: one bullish, 12 bearish.
Industrials: three bullish, 11 bearish.
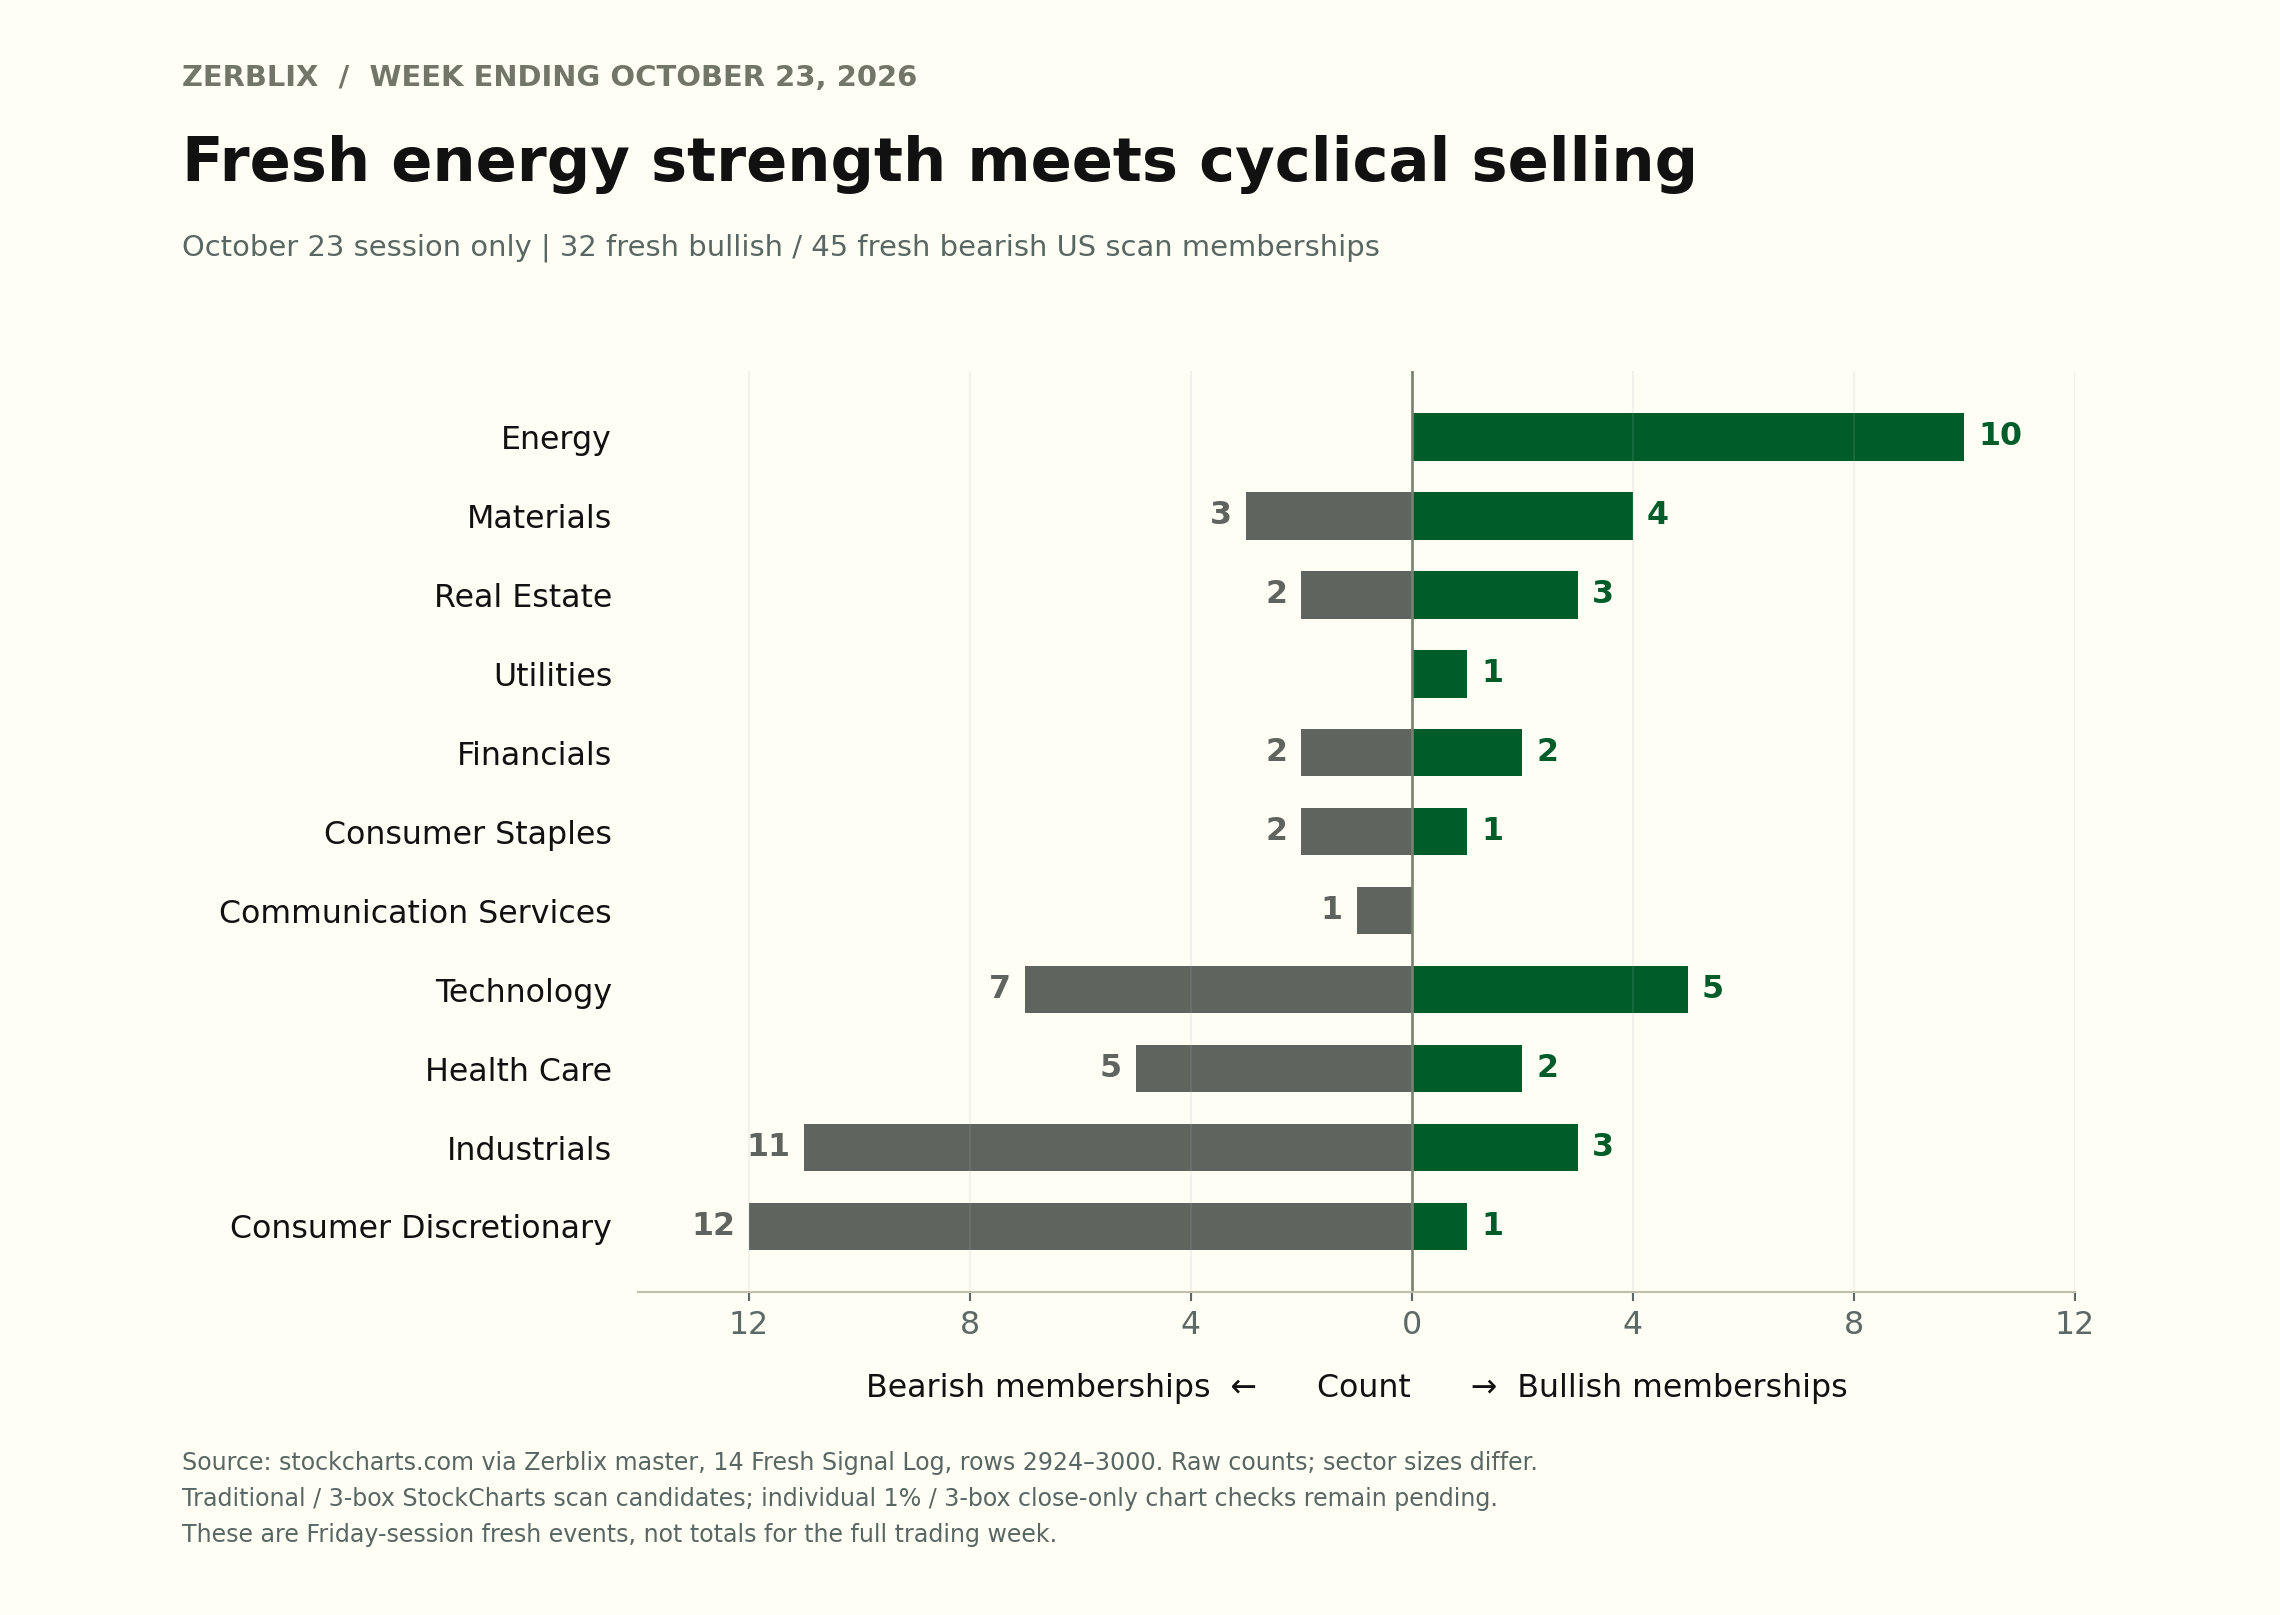
These are October 23 session results—not cumulative totals for the trading week. They identify candidates for chart review, not completed investment conclusions.
Industrial price performance added a further qualification: XLI declined 1.87% during the week. The group needs evidence that downside signals are stalling or reversing before the recovery case becomes more persuasive.
Sector breadth reveals useful disagreements
Healthcare retained price strength, but its breadth evidence was not uniformly supportive. XLV gained 1.45% during the week, and healthcare Bullish Percent Index (BPI) increased between Friday endpoints. Friday’s daily Bullish Percent Index (BPI) change was negative, however.
Materials showed a different disagreement: sector buy-signal breadth expanded while several metals-related exposures appeared in weakness screens.
Sector Bullish Percent Index (BPI)— October 23
Weekly changes compare October 16 with October 23. Friday daily changes describe October 23 only. All changes below are in percentage points (pp).
Energy
Current BPI: 66.67%
Weekly change: unchanged, 0.00 pp
Friday daily change: +14.29 pp
Healthcare
Current BPI: 81.36%
Weekly change: +8.48 pp
Friday daily change: −3.39 pp
Financials
Current BPI: 59.21%
Weekly change: +10.53 pp
Friday daily change: unchanged, 0.00 pp
Materials
Current BPI: 53.85%
Weekly change: +15.39 pp
Friday daily change: +3.85 pp
Communication services
Current BPI: 20.51%
Weekly change: −5.13 pp
Friday daily change: −2.56 pp
Workbook classification: Unclassified for all five groups, pending ETF-specific P&F structure review. Friday daily changes are source-reported context and remain separate from weekly changes.
The practical question is which industries account for sector improvement, and whether their signals survive. A stronger sector BPI does not establish that every related industry is strengthening.
Financial stress remains below average
The St. Louis Fed Financial Stress Index remained below zero in every weekly observation from June 26 through October 16.
Its latest reading was −0.6328, compared with −0.7205 on October 9. The increase of 0.0877 index points indicates that financial stress rose during that week while remaining below its historical average.
[
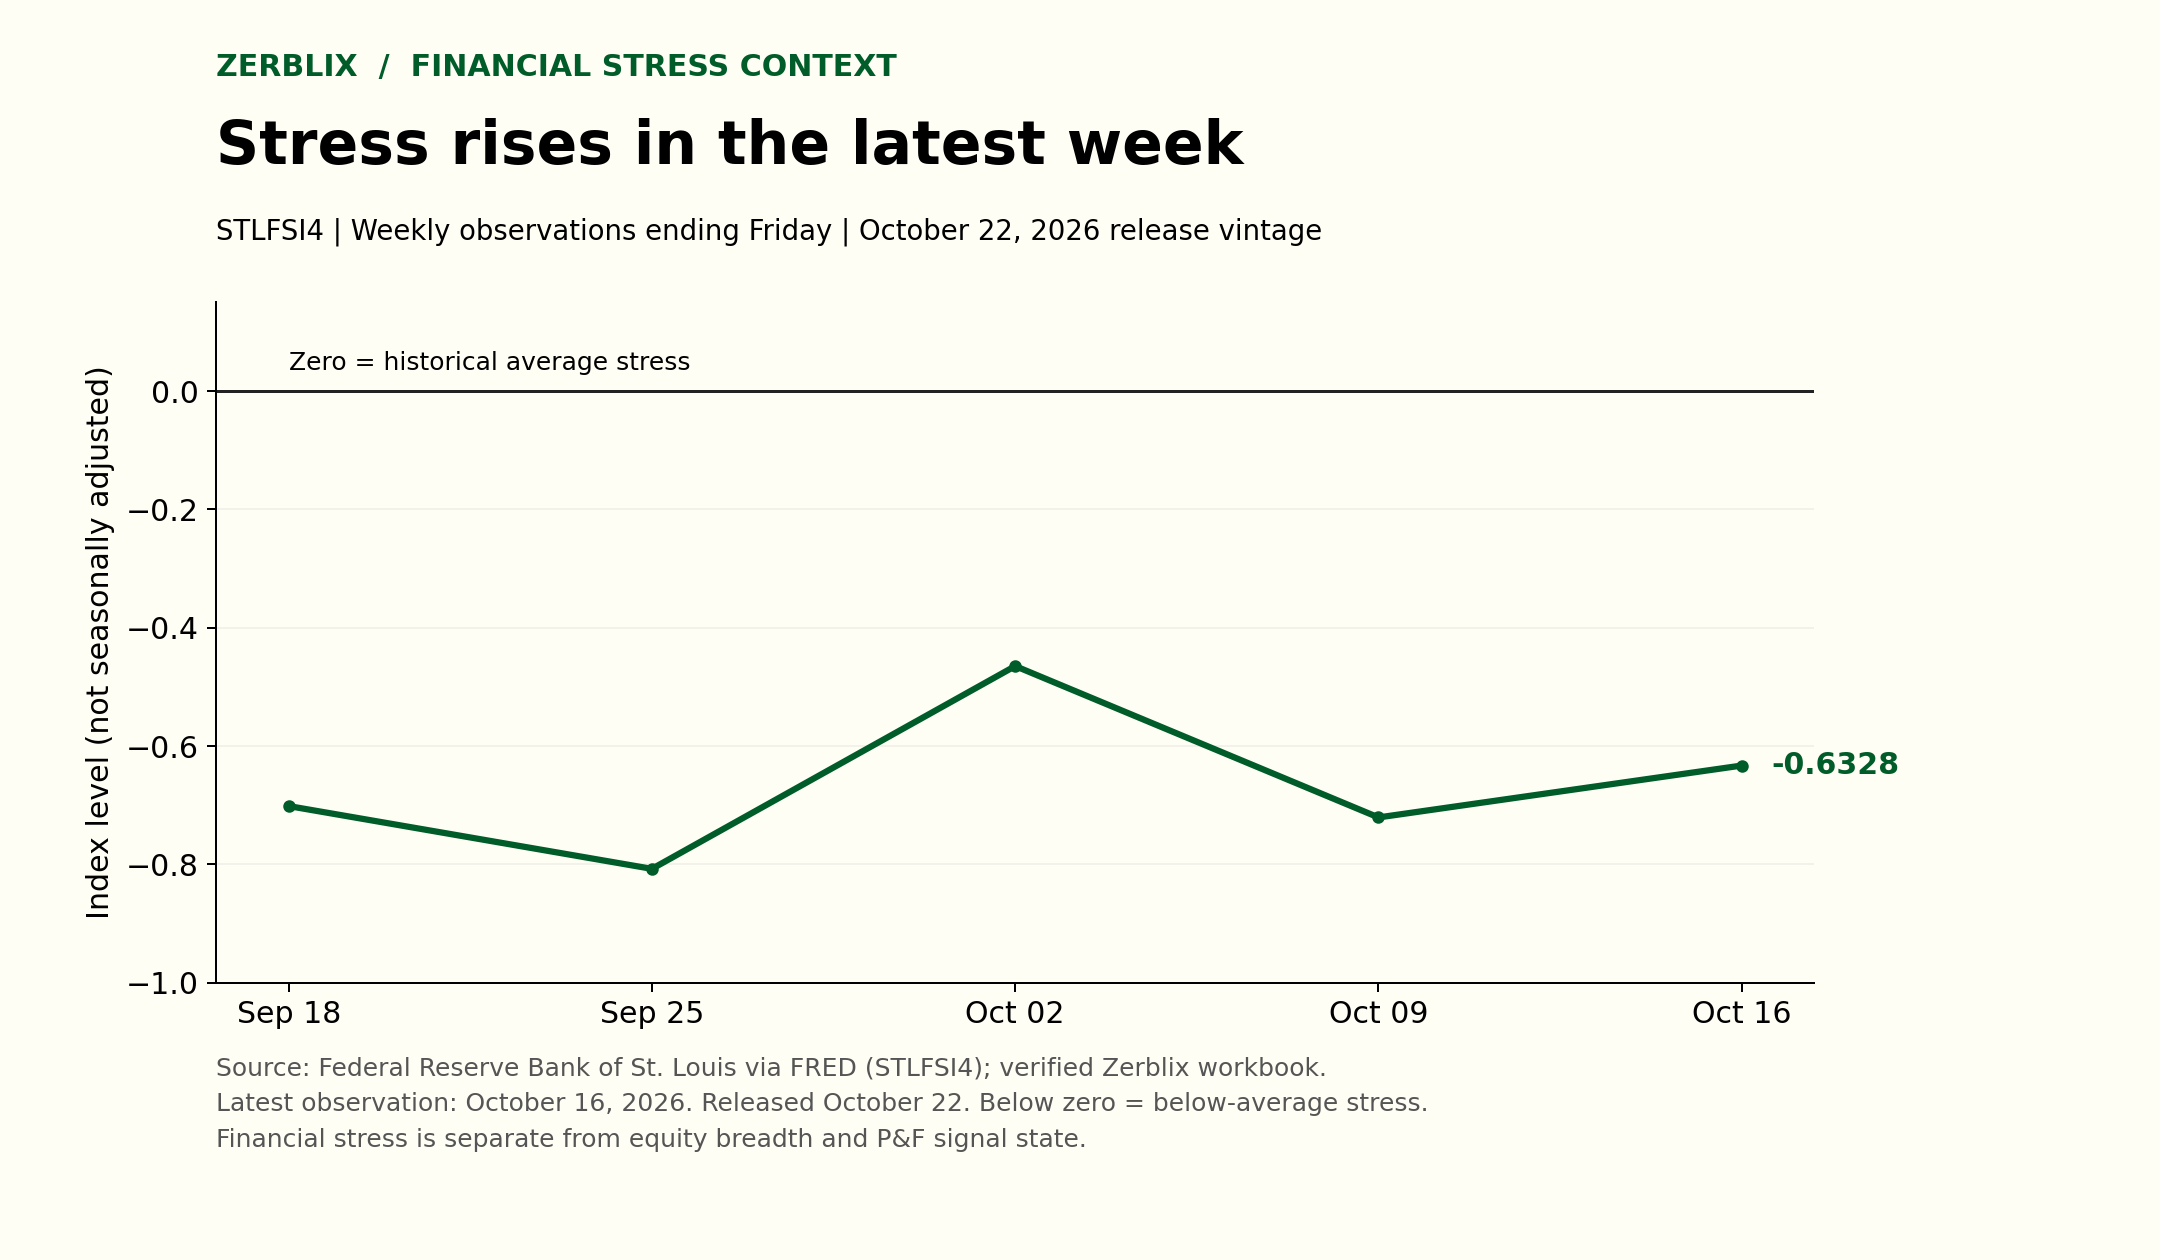
This is lagged context for the October 23 market review, not an October 23 stress reading.
Subdued financial stress can coexist with selective equity demand and weakening participation in individual groups. It does not confirm broad equity strength or invalidate bearish P&F signals.
A persistent rise in stress accompanied by broader participation losses would make the backdrop less supportive. For now, the useful distinction is between below-average financial stress and uneven equity participation.
What needs to follow through
Watch whether the rotation holds:
Energy: Signals survive across commodity exposure, related equities and stock candidates.
Small caps: Rising-column participation sustains its weekly improvement.
Nasdaq-100: Rising columns recover while buy signals hold.
Healthcare: P&F structure provides firmer confirmation of price strength.
Weaker groups: Fresh downside signals stall rather than spread.
Financial stress: The latest increase fades rather than persists alongside weakening breadth.
Leadership is rotating, but confirmation remains uneven. Energy showed the clearest agreement across related exposures. Small-cap participation improved during the week, while Nasdaq participation contracted and Friday’s fresh US signals favored bearish candidates.
Stabilization in weaker groups would strengthen the outlook. Failed energy signals, renewed small-cap deterioration or selling that reaches the remaining leaders would weaken it.