


The market ended the week with a meaningful improvement in selected large-cap areas, but the improvement was not broadly distributed.
The strongest change came from the Nasdaq 100. Its Zerblix Pattern Pressure improved from −69.9 on September 11 to −28.8 on September 18, a substantial reduction in bearish pattern pressure.
The broader market did not confirm that improvement to the same degree. S&P 500, mid-cap and small-cap participation remained depressed, while Friday produced considerably more new P&F downside breaks than upside breaks.
The week’s central condition is therefore not an absence of demand.It is demand concentrated in a relatively narrow part of the market.
At a Glance
Nasdaq repair: Nasdaq 100 Pattern Pressure improved sharply to −28.8.
Breadth remains narrow: all five core universes finished with less than 40% of members in rising X-columns.
Fresh supply dominated: 65 new U.S. downside P&F breaks versus 20 new upside breaks.
Leadership remains selective: Energy retains stronger structure; Health Care is improving; Technology continues to show concentrated rather than broad leadership.
10-year context: the latest SPY–RSP and QQQ–QQQE performance gaps are unusually wide relative to the past decade.
Breadth Has Not Yet Confirmed the Index Repair
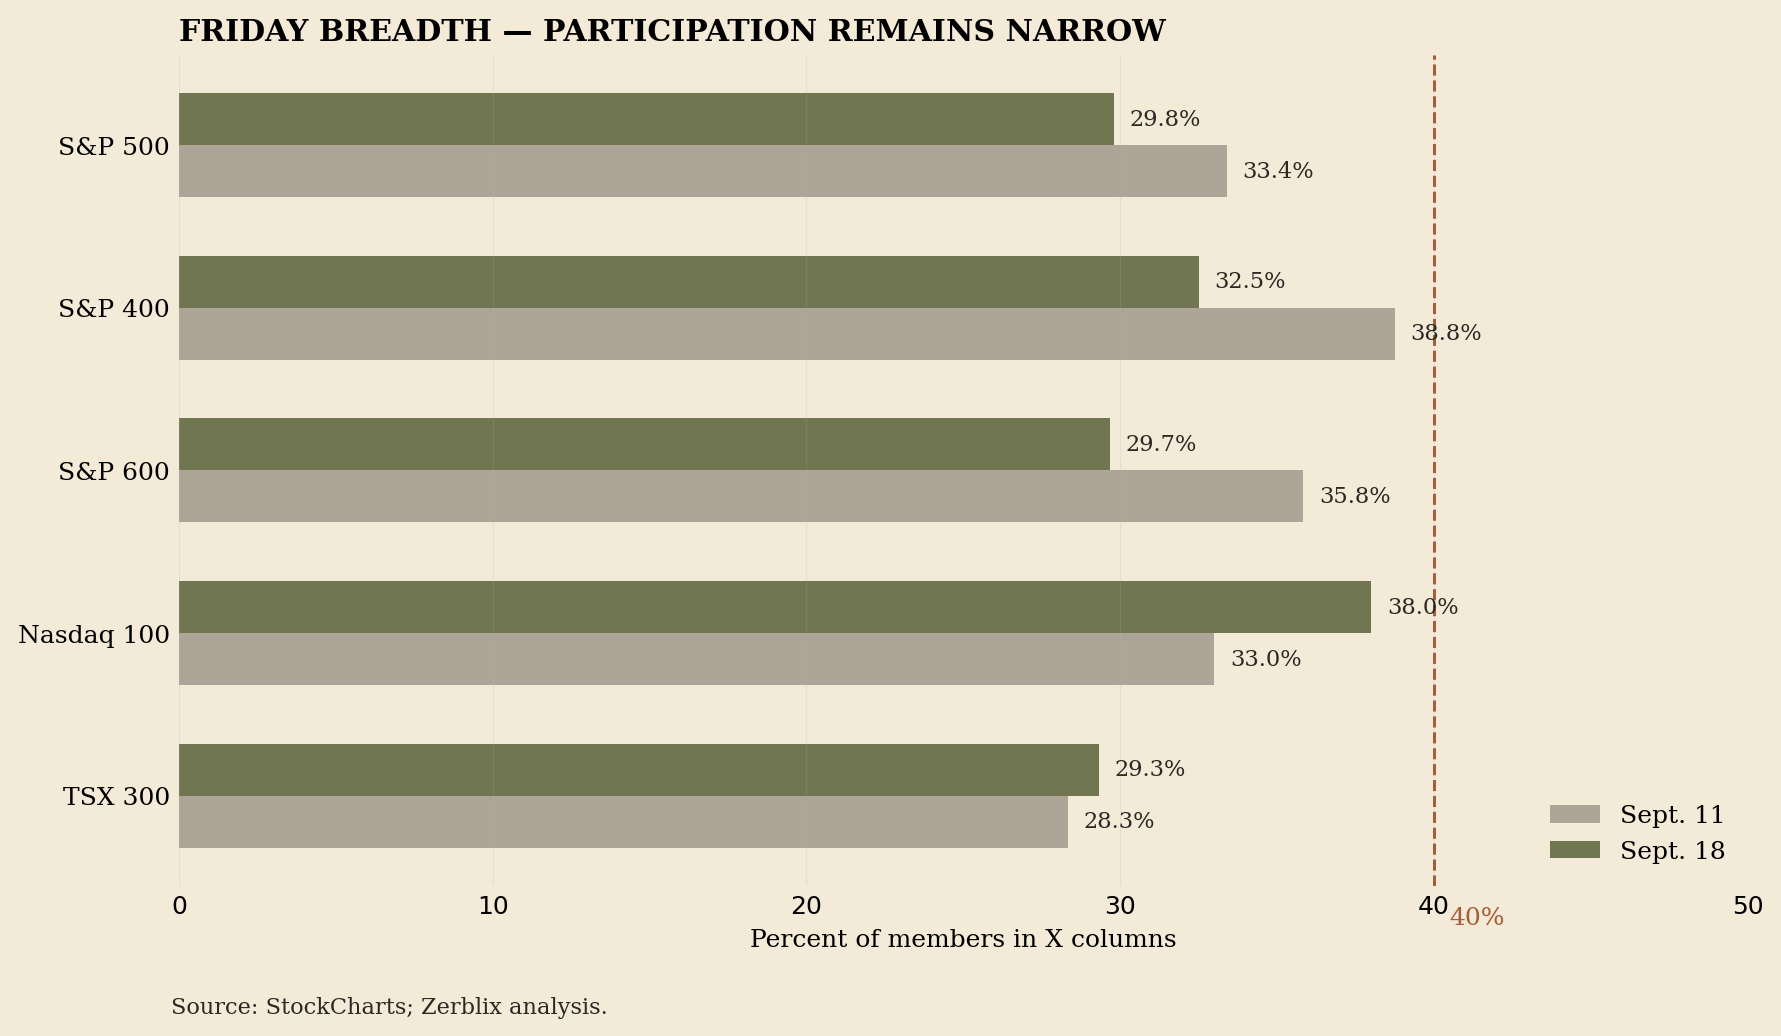
X-column participation measures the percentage of stocks currently advancing in rising Point & Figure columns. It gives a direct reading of how widely demand is spreading through a market.
Friday’s readings were:
S&P 500 — 29.8%
S&P 400 — 32.5%
S&P 600 — 29.7%
Nasdaq 100 — 38.0%
TSX 300 — 29.3%
The Friday-to-Friday changes are more revealing.
S&P 500 participation declined from 33.4% to 29.8%. The S&P 400 fell from 38.8% to 32.5%, while the S&P 600 declined from approximately 35.8% to 29.7%.
The Nasdaq 100 was the exception, improving from 33.0% to 38.0%. Canada improved only modestly, from roughly 28.3% to 29.3%.The structure shows demand returning more forcefully to the Nasdaq than to the broader market.
From a supply-and-demand standpoint, that distinction matters. A stronger and more durable advance would normally begin pulling a larger share of stocks into rising columns. Friday did not provide that confirmation.
Pattern Pressure Shows Where the Repair Occurred
Pattern Pressure compares selected bullish and bearish P&F pattern families within each universe. Positive readings indicate that demand-side structures are more prevalent; negative readings indicate that supply-side structures remain dominant.
The September 18 readings were:
Nasdaq 100: −28.8
S&P 500: −51.6
S&P 400: −46.0
S&P 600: −39.6
TSX 300: −17.2
The level alone does not tell the entire story.
The Nasdaq 100 improved from −69.9 one week earlier to −28.8. That is meaningful structural repair. The S&P 500 changed much less, from approximately −53.3 to −51.6. Mid-cap Pattern Pressure weakened from −39.5 to −46.0, while small-cap pressure moved from −32.5 to −39.6.
The market therefore did not experience a uniform bullish shift.
Instead, Nasdaq supply pressure contracted rapidly while broader-market pressure remained elevated.
That is constructive for Nasdaq leadership, but broader confirmation would require the improvement to spread into the S&P universes.
If Pattern Pressure begins improving across the S&P 500, S&P 400 and S&P 600 while X-column participation rises at the same time, the current selective repair would be developing into a broader demand phase.
If the Nasdaq continues to improve while those measures remain depressed elsewhere, concentration remains the dominant condition.
New Supply Still Had the Wider Footprint
Friday’s new-signal evidence also favored the supply side.
There were:
20 new U.S. P&F upside breaks
versus
65 new U.S. P&F downside breaks
These are new events—not the entire inventory of existing bullish or bearish patterns.
The difference is substantial. New downside breaks appeared at more than three times the rate of new upside breaks.
The distribution adds another layer.
Technology accounted for 11 of the 20 upside signals, including a semiconductor/electronics cluster involving ALAB, ARM, FORM, QCOM, SWKS and COHR.
Health Care contributed another four upside signals.
That is legitimate demand, but it is concentrated.
The downside side was distributed much more broadly:
Consumer Discretionary: 15
Financials: 14
Technology: 8
Communication Services: 7
Industrials: 6
Health Care: 5
The implication is not that every part of the market is deteriorating.
It is that new supply is still appearing across more groups than new demand.
That condition would begin to improve if the downside count contracts while new upside signals spread beyond Technology and Health Care.
Energy, Health Care and Technology Are Not the Same Kind of Leadership
The stronger areas of the market are developing through different structural paths.
Energy — Established, but Cooling Internally
Energy remains one of the better-aligned groups.
Its sector BPI finished at 71.4, meaning a substantial majority of Energy stocks remained on P&F buy signals. Pattern Pressure was also positive at approximately +22.8.
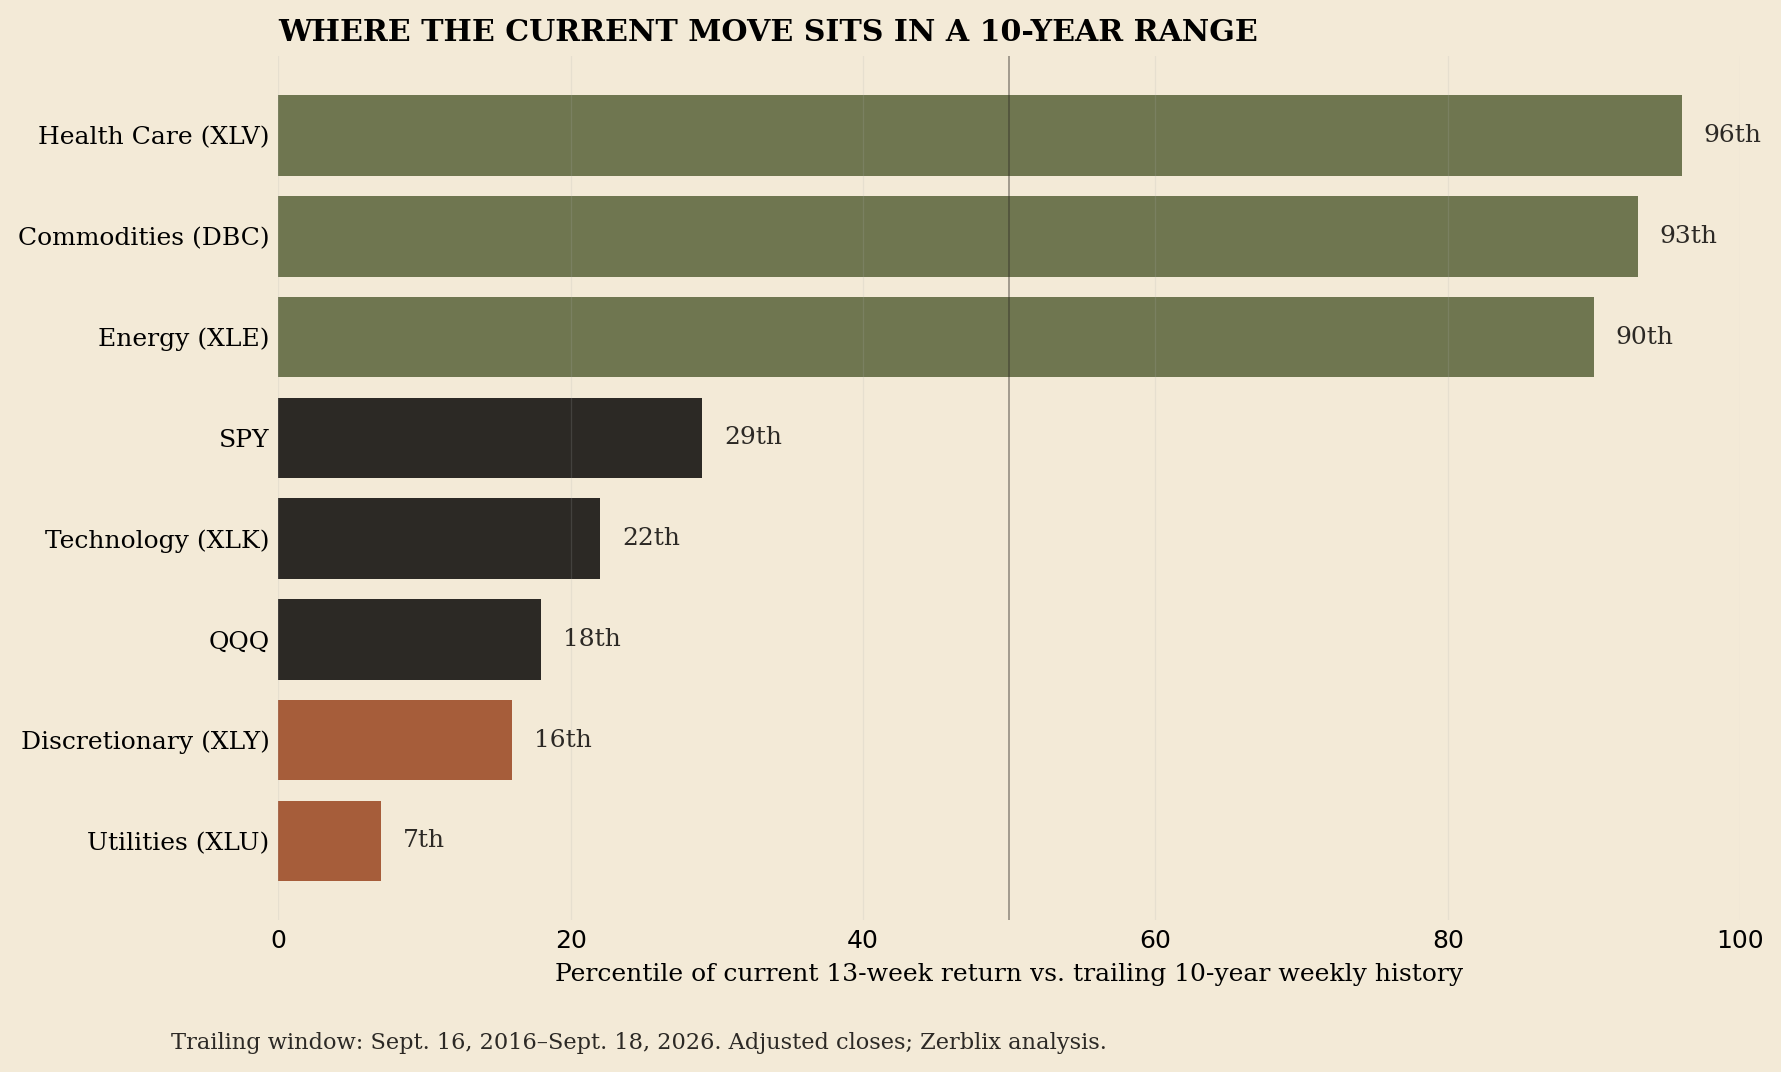
The intermediate price trend supports that structure. XLE gained approximately 20.5% over the latest 13 weeks, placing the move toward the stronger end of its own historical range. But there is an important qualification.
Energy BPI fell from roughly 90.5 to 71.4 in one week.
Demand remains dominant by level, but participation contracted.
The Energy interpretation therefore remains constructive while the sector holds positive Pattern Pressure and avoids another material deterioration in BPI. A continued decline in participation would indicate that established leadership is becoming progressively narrower.
Health Care — Improving Breadth, Incomplete Pattern Confirmation
Health Care developed through a different mechanism.
Its BPI improved from approximately 52.5 to 62.7, while several Health Care stocks produced new upside breaks.
XLV’s intermediate price behavior is also unusually strong relative to its own historical experience.
But Pattern Pressure remained negative at approximately −24.3.
The measures are therefore not fully aligned.
Breadth and price momentum are improving, while the overall mix of P&F pattern families still contains more supply-side than demand-side pressure.
That makes Health Care a developing leadership area rather than a completed structural confirmation. Additional improvement in Pattern Pressure would strengthen the case. A reversal in BPI or failure of the new upside signals would weaken it.
Technology — Leadership Without Broad Participation
Technology supplied more than half of Friday’s new U.S. upside breaks.
That is significant.
But sector BPI finished at only 45.1, while Pattern Pressure remained negative at approximately −13.2.
The sector therefore contains individual stocks showing strong demand without yet producing uniformly strong participation across the group.
That is consistent with the Nasdaq 100 evidence.
Technology leadership remains important, but it is selective.
The next confirmation would be survival of the new breakouts together with improvement in sector BPI and Pattern Pressure.
Without that follow-through, strong individual names can continue to support the index while the broader technology structure remains mixed
Several Areas Still Show Persistent Supply
The weak side of the market is more broadly aligned.
Consumer Discretionary
Consumer Discretionary produced one of the clearest negative combinations:
BPI: 16.7
Pattern Pressure: approximately −64.0
15 new downside breaks
Recent XLY performance remained under pressure
Breadth, fresh signals and pattern structure are pointing in the same direction.
The sector would need more than a short rebound to materially alter that interpretation. Improvement would require fewer new breakdowns, stabilization in BPI and a sustained improvement in Pattern Pressure.
Materials
Materials BPI fell to approximately 26.9, while Pattern Pressure reached roughly −52.2.
That is a combination of low participation and persistent bearish structure.
Utilities
Utilities finished with BPI near 25.8 and Pattern Pressure around −47.0.
Utility-related ETFs also appeared repeatedly in confirmed weakness.
That repetition matters because it indicates weakness appearing through more than one analytical layer.
Real Estate
Real Estate Pattern Pressure remained near −44.0. Utility-related ETFs also appeared repeatedly in confirmed weakness.
That repetition matters because it indicates weakness appearing through more than one analytical layer.
Real Estate
Real Estate Pattern Pressure remained near −44.0.
VNQ also appeared in both three-month emerging weakness and broad confirmed ETF weakness.
Repeated weakness across pattern structure and ETF scans gives the Real Estate condition more weight than a one-time signal.
Financials Are Sending a Mixed Message
Financials are worth separating from the clearly weak groups because the evidence does not completely agree.
Sector BPI declined from approximately 47.4 to 36.8.
Financial stocks also produced 14 new downside breaks, one of Friday’s largest sector concentrations.
Yet Financial Pattern Pressure remained slightly positive at approximately +8.9.
That divergence suggests that older bullish structures remain present even while a new layer of downside pressure has developed among individual stocks.
This is the kind of disagreement that deserves monitoring rather than forced classification.
If the new breakdowns persist and Pattern Pressure falls below zero, the negative interpretation would become more complete.
If new downside signals contract while Pattern Pressure remains positive and BPI stabilizes, the recent deterioration may prove to be a corrective phase rather than a deeper structural reversal.
Historical Context: Concentration Is the Bigger Story
The trailing 10-year price history provides an important perspective on the current market.
Large-cap leadership itself is not unusual.
Over the decade, cap-weighted large-cap growth has consistently outperformed many broader and equal-weight measures.
What is more unusual today is the size of the short-term separation.
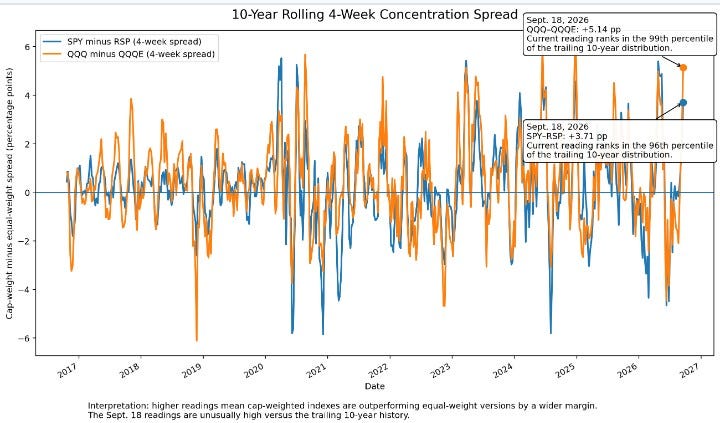
Over the latest four weeks:
SPY: approximately −0.5%
RSP: approximately −4.2%
That leaves SPY ahead of equal-weight RSP by roughly 3.7 percentage points. Relative to comparable rolling four-week observations over the trailing decade, that spread ranks around the 96th percentile.
The Nasdaq concentration is even more pronounced.
QQQ: approximately +1.1%
QQQE: approximately −4.0%
That produces a spread of roughly 5.1 percentage points, near the 99th percentile of comparable observations during the past 10 years.
That distinction is important.
The breadth data tells us participation is narrow.
The historical comparison tells us how unusually narrow the recent cap-weighted leadership has become.
GRAPH 3 — BEST HISTORICAL GRAPH TO ADD HERE
10-Year Rolling 4-Week Concentration Spread
Plot:
SPY minus RSP
QQQ minus QQQE
September 2016 through September 2026
Mark the current readings:
SPY–RSP: +3.7 percentage points
QQQ–QQQE: +5.1 percentage points
Annotate approximately 96th percentile / 99th percentile
Caption:
Rolling four-week cap-weighted minus equal-weight return spreads. The September 18 readings show unusually wide concentration relative to the trailing 10-year history. Source: verified adjusted-close history; Zerblix analysis.
This is the most valuable additional graph for the article.
It visually proves the central thesis instead of simply repeating another ranking.
Commodities Continue to Show Persistence
Broad commodities remain one of the stronger multi-horizon areas in the Zerblix universe.
DBC gained approximately:
+5.3% over 4 weeks
+19.2% over 13 weeks
+52.9% over 52 weeks
Both the 13-week and 52-week advances rank toward the stronger end of DBC’s trailing decade history.
That persistence matters.
It suggests that commodity strength is not simply the result of one strong Friday or one short-lived breakout.
Precious metals are more mixed. GLD retains positive 52-week performance but has experienced weaker recent momentum. SLV remains substantially stronger over the longer horizon but has also undergone shorter-term contraction.
That makes recent precious-metal strength better described as repair within a larger advance until additional follow-through develops.
Internationally, Taiwan also remains notable. EWT’s longer-horizon performance is exceptionally strong relative to its trailing history, while Brazil has improved across multiple intermediate horizons.
Those are areas to continue monitoring for structural confirmation rather than treating price strength alone as sufficient evidence.
What Friday Established
The September 18 evidence confirms a market with selective leadership and narrow participation.
There is real demand.
The Nasdaq 100 repaired sharply. Energy retains positive internal structure. Health Care breadth is improving. Technology continues to produce important individual upside breaks. Broad commodities retain strong intermediate persistence.
But that demand has not yet become broadly distributed.
The S&P 500, S&P 400 and S&P 600 ended the week with roughly one-third or less of their members in rising P&F columns.
New downside breaks outnumbered new upside breaks by more than three to one.
Consumer Discretionary, Materials, Utilities and Real Estate remain under significant supply pressure.
And historically, the short-term separation between cap-weighted and equal-weight indexes is unusually wide.
Taken together, the evidence argues for selective repair rather than broad confirmation.
The Week Ahead
The most important question next week is not simply whether the major indexes rise.
It is whether participation begins to rise with them.
A more constructive structure would include:
Higher X-column participation across the S&P 500, S&P 400 and S&P 600.
Fewer new downside P&F breaks relative to new upside breaks.
Improving Pattern Pressure outside the Nasdaq 100.
Stabilization in Energy BPI after its recent contraction.
Further improvement in Health Care Pattern Pressure.
Survival and expansion of Technology’s new upside signals.
The current interpretation would weaken if Nasdaq repair reverses, existing leaders lose participation, or downside signals continue to spread while broad-market breadth remains near current levels. For now, Friday's evidence leaves the market in a familiar but important position: The indexes can continue to advance, but broader demand still has something to prove.
Quick Definitions
X-column participation — the percentage of stocks currently advancing in rising Point & Figure columns. It measures immediate demand-versus-supply participation.
BPI — the percentage of stocks in a universe currently carrying P&F buy signals. It measures structural participation and is distinct from X-column participation.
Pattern Pressure — a Zerblix measure comparing selected bullish and bearish P&F pattern families. Positive values indicate greater demand-side pattern pressure; negative values indicate greater supply-side pressure.
New P&F signal — a newly appearing breakout or breakdown on the effective date, rather than the full inventory of existing patterns.