


Record index prices demonstrate strength. Participation reveals how extensively that strength is shared.
The S&P 500 and Nasdaq Composite reached record closing highs. Their price achievements demonstrate continued demand, although underlying Point and Figure (P&F) participation provides a more qualified assessment of the advance.
What the Bullish Percent Readings Show
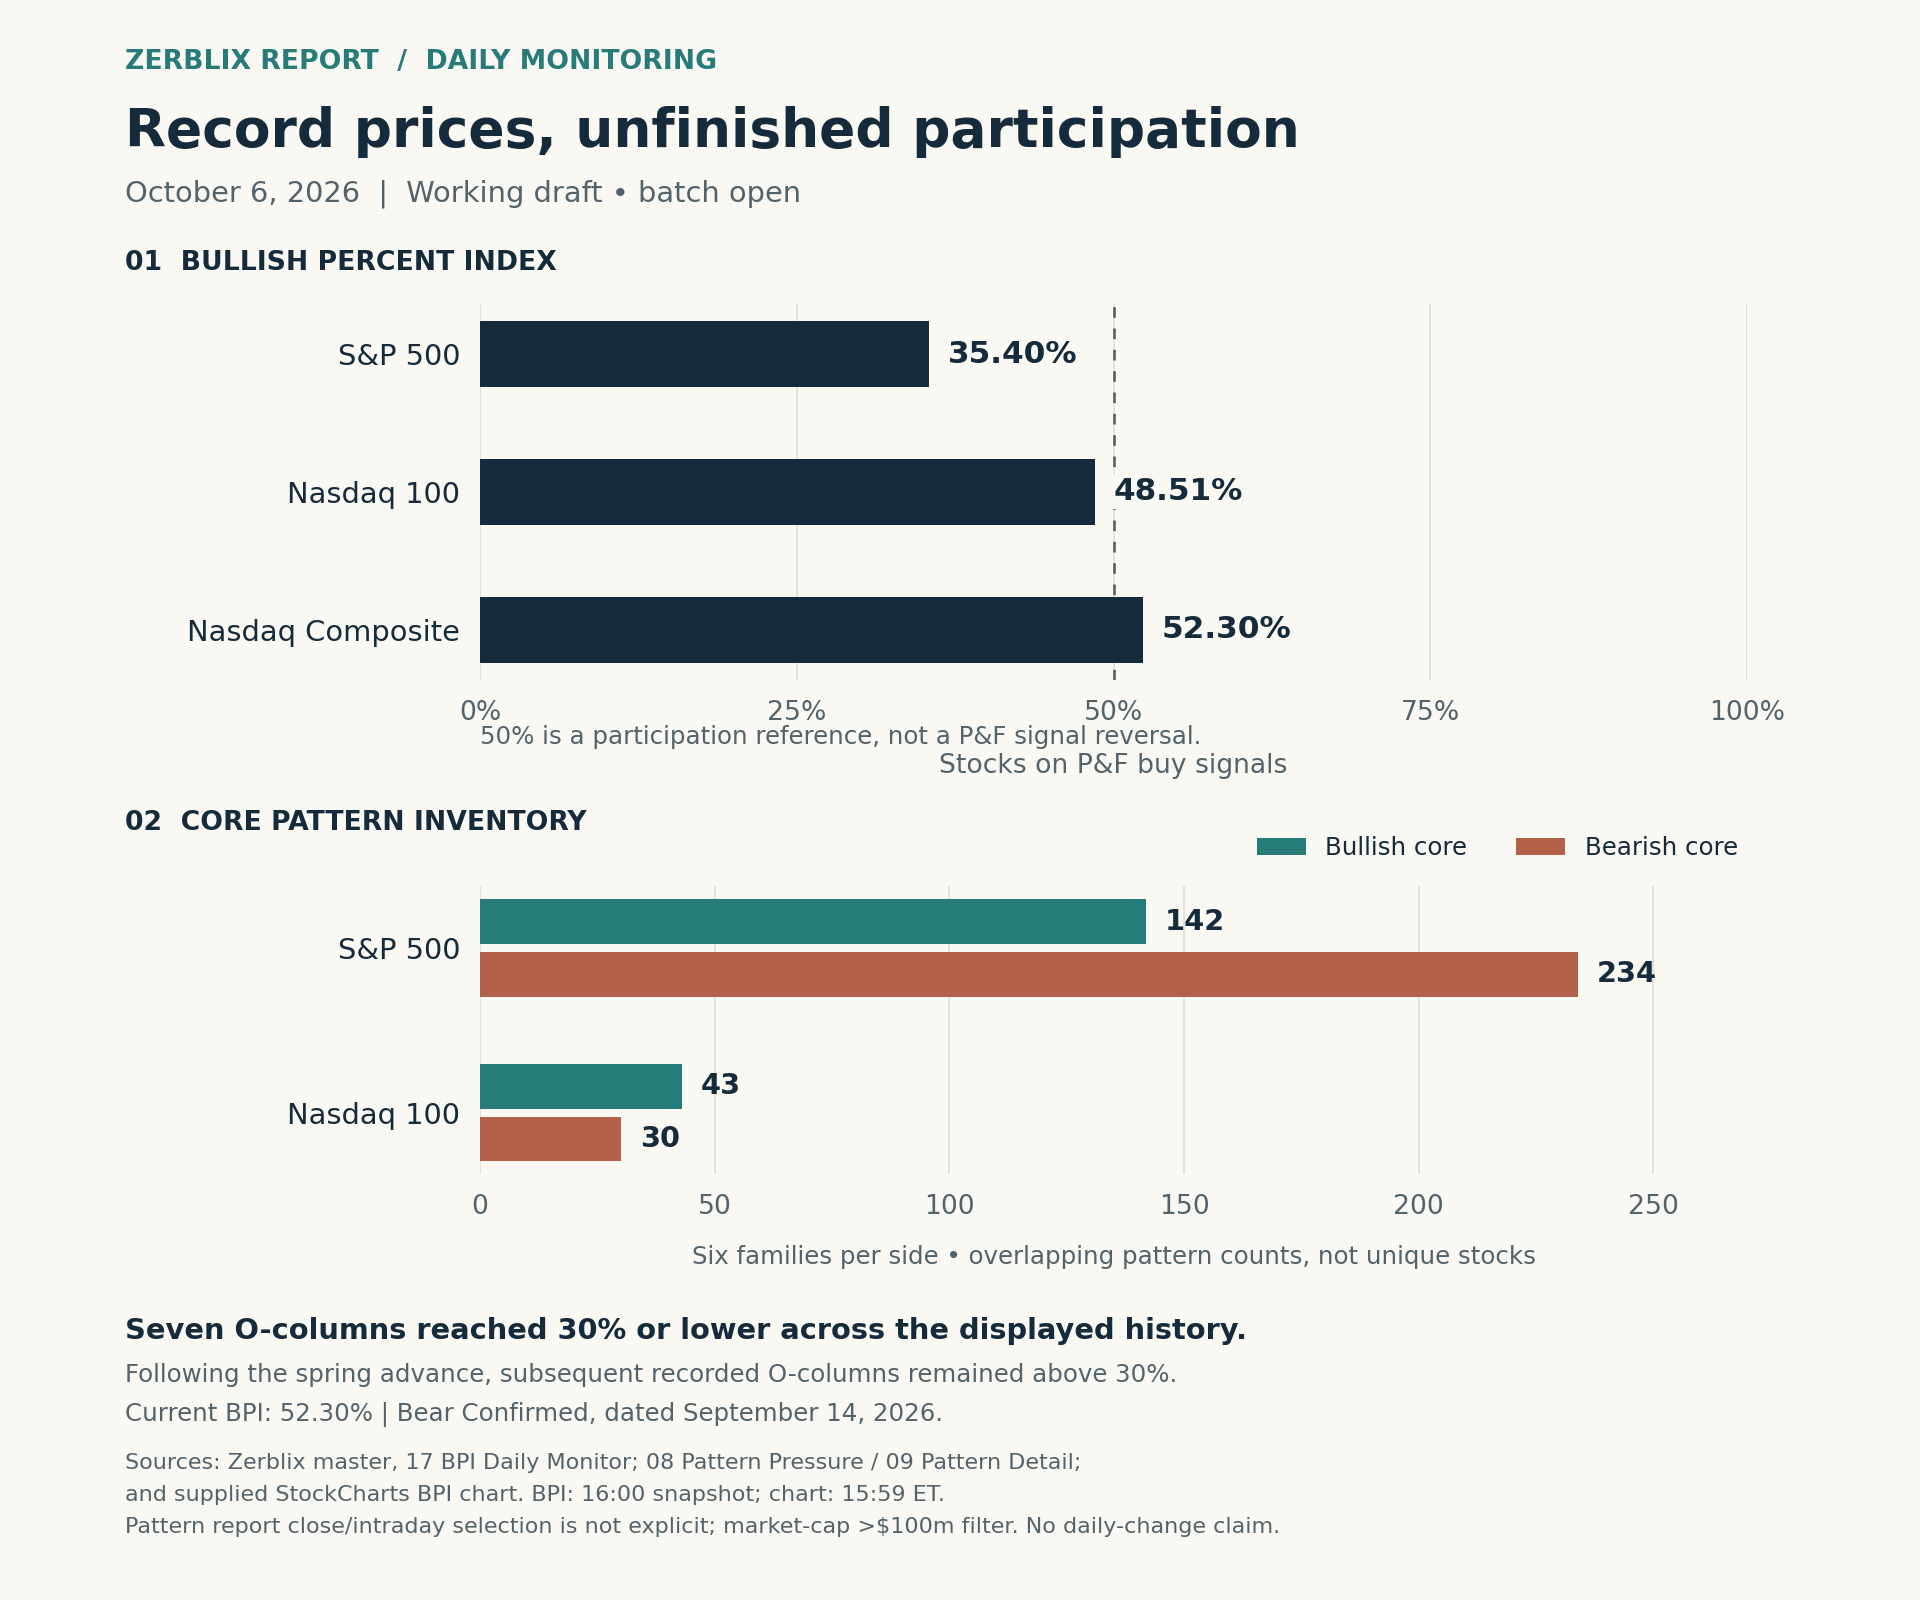
The Bullish Percent Index (BPI) measures the percentage of constituents on Point and Figure (P&F) buy signals. The October 6 readings are:
S&P 500: 35.40%
Nasdaq 100: 48.51%
Nasdaq Composite: 52.30%
Fewer than half the constituents in the S&P 500 and Nasdaq 100 are on buy signals. Nasdaq Composite participation is stronger, with a modest majority retaining bullish signals. These are different universes, and their readings should remain separate.
Demand is sufficient to carry the headline indexes to new highs, while bullish signals remain less extensive beneath those price advances.
Seven Visits to the Oversold Zone
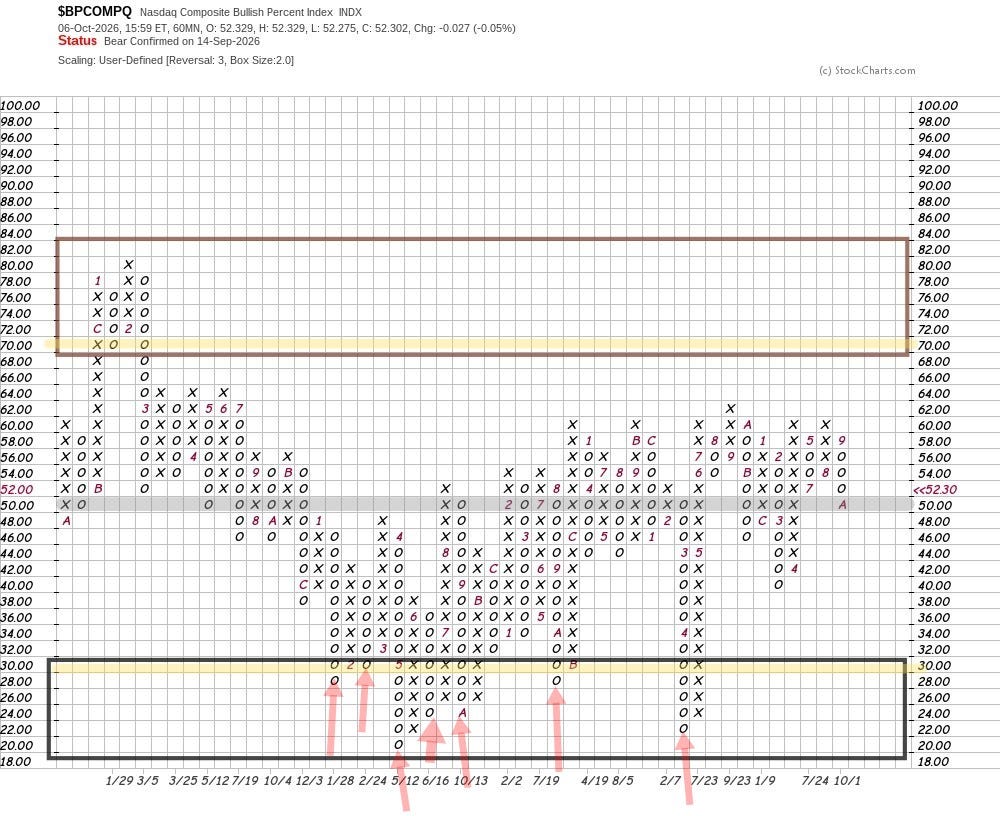
Across the supplied Nasdaq Composite Bullish Percent Index (BPI) chart, seven separate O-columns reached 30% or lower. These episodes marked substantial contractions in bullish participation. Subsequent X-column reversals recorded renewed participation, although reaching the lower threshold alone did not establish a bottom.
The spring advance marked by “4” for April provides an important qualification:
Following the spring advance, subsequent columns of O’s have remained above the 30% level. These declines indicate less extensive deterioration in bullish participation than the earlier oversold episodes. The current Bear Confirmed signal nevertheless remains intact, pending an upside reversal and a buy signal.
The Reading and the Signal
At 52.30%, a modest majority of Nasdaq Composite constituents remain on P&F buy signals. The indicator’s own chart nevertheless remains in a column of O’s with a Bear Confirmed signal.
Three conditions must be distinguished:
The percentage reading describes the extent of bullish participation.
The column direction records an advance or decline in that participation.
The active P&F signal identifies a breakout above a preceding X-column high or a breakdown below a preceding O-column low.
A reading above 50% therefore does not automatically cancel an existing sell signal. The less severe declines following the spring advance provide constructive context, while the current signal continues to qualify that strength.
Pattern Balance Remains Uneven
Zerblix’s core pattern inventory shows differing conditions:
S&P 500: 142 bullish versus 234 bearish occurrences.
Nasdaq 100: 43 bullish versus 30 bearish occurrences.
The S&P 500 retains a bearish balance, while Nasdaq 100 has a bullish balance. These totals use the existing six-family convention on each side. They count overlapping pattern occurrences—not unique stocks or fresh signals.
Equal Weight Participated; Small Caps Lagged
The supplied daily ETF snapshot adds some confirmation beyond the largest constituents:
RSP and QQQE: both gained 0.57%.
SPY: gained 0.55%.
QQQ: gained 0.46%.
IWM: declined 0.72%.
Equal-weight participation supported today’s advance, while small caps did not join. One session identifies a developing condition; it does not establish sustained intermediate leadership.
What Would Confirm Repair?
For Nasdaq Composite BPI, an upside reversal into X’s would indicate initial repair. If the sell signal remained intact, that advance would represent Bear Correction. A subsequent breakout above the preceding X-column high would reverse the sell signal and establish Bull Confirmed.
Stronger confirmation would include:
Broader participation in P&F buy signals.
Bullish breakouts surviving subsequent reactions.
A less bearish S&P 500 core-pattern balance.
Further downside extension or failed bullish signals would weaken the repair interpretation. A renewed approach toward 30% would challenge the less severe pattern of declines recorded since the spring advance.