


Real Estate Select Sector SPDR ETF’s (XLRE) relative-strength chart against SPY shows an established decline interrupted by rallies that have failed to restore earlier relative highs. The latest breakdown extends that deterioration: repeated support at 57.32 was penetrated at 56.19, completing a Triple Bottom Breakdown. The O-column that began in August has subsequently extended to 52.95.
The significance lies in the failure of repeated support and the follow-through beneath it. Two preceding reactions stopped at the same relative level, indicating that demand had been sufficient to interrupt the declines. The intervening rallies, however, did not establish a durable recovery. When the third decline penetrated that floor, the balance shifted further toward supply. Continued O-column extension shows that the breakdown has persisted beyond its initial trigger.
This is a statement about XLRE’s performance relative to SPY. Real estate can advance in price while losing relative ground if the benchmark advances more rapidly. Conversely, a declining ratio can reflect XLRE falling while SPY holds steady, or XLRE declining more sharply than the benchmark. The chart establishes persistent underperformance without requiring the two funds to move in opposite directions.
The Friday evidence already supported a lagging interpretation. XLRE/SPY declined 7.04% from September 4 to October 2 and 11.61% from July 2 to October 2. October 2’s broader real-estate pattern dataset contained 34 core bullish matches against 130 bearish matches. These are established-pattern prevalence counts, separate from the fresh signals subsequently recorded in the daily scans.
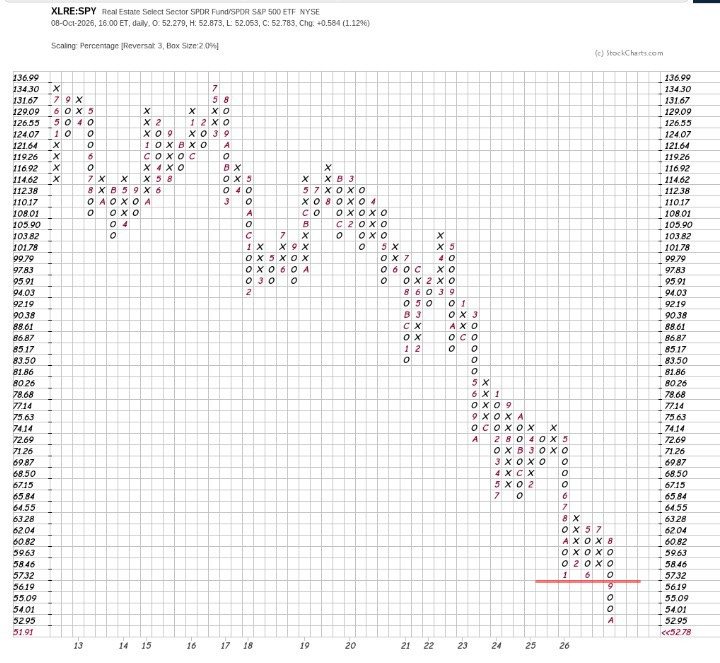
The August O-column penetrated repeated support at 57.32, completing a **Triple Bottom Breakdown at 56.19**, and extended to 52.95. Demand that previously interrupted two declines has yielded to further relative weakness. An upside reversal would indicate initial stabilization; a subsequent buy signal would provide stronger evidence of renewed leadership.
The 2% / three-box chart helps place the weakness within a broader structure. Percentage scaling keeps the boxes proportional to price, while the three-box reversal filters smaller counter-movements. I use this setting to examine substantial advances and reactions, accepting that a larger move must occur before the chart records a reversal. A breakdown surviving this filter deserves attention, although the setting does not assign a fixed duration to the resulting signal.
Welltower, Inc. (WELL) connects that sector picture with an important constituent. It was the sole real-estate match in October 5’s fresh Double Bottom Breakdown scan, using Traditional scaling with a three-box reversal. Separately, State Street’s October 7 holdings dataset identifies Welltower as XLRE’s largest holding, at 11.32%. CBRE, another bearish scan match on October 7, represented 4.32%. Their weights establish their relevance to the fund; they do not quantify their contributions to its decline.
On WELL’s displayed 2% / three-box chart, the reaction is approaching a different structural test. An O-column extension to $216.01 would confirm the developing High Pole under the source-book definition, retracing more than half the preceding X-column. That would represent a 12.94% decline from the plotted peak of $248.13 and indicate that supply had substantially eroded the demand supporting the advance. The High Pole remains unconfirmed.
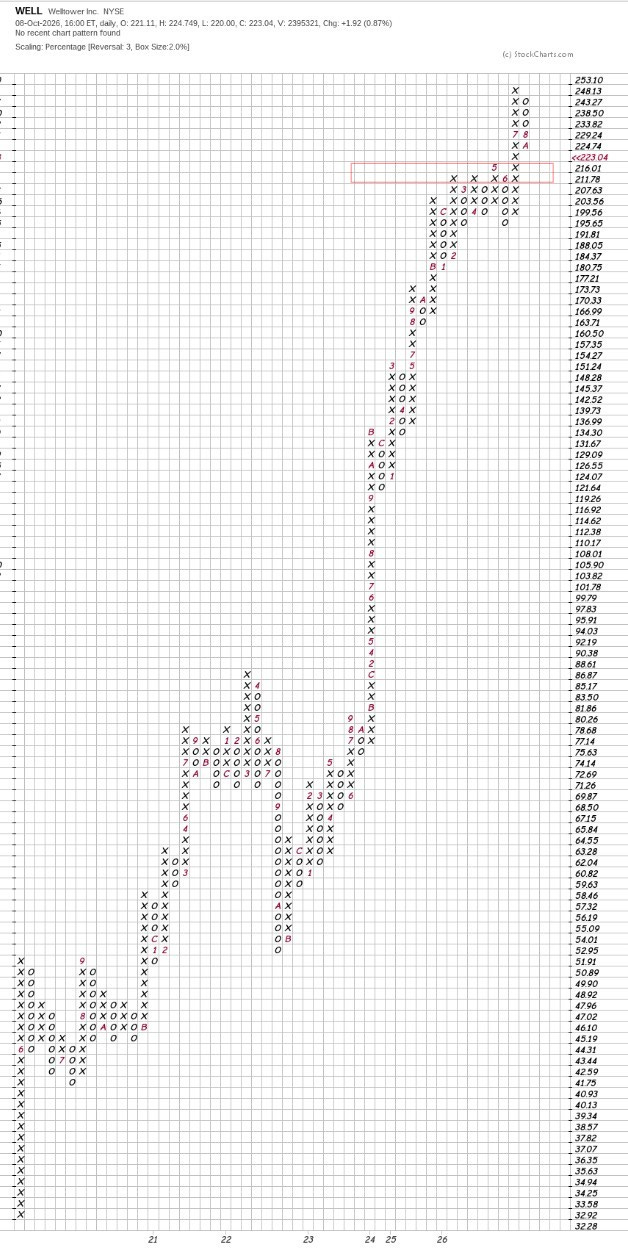
The red rectangle around $211.78–$216.01 adds context. It marks the earlier resistance and breakout area, which may now attract demand during the reaction. The High Pole threshold therefore coincides with a return toward potential support. A High Pole could confirm while that support still holds: the warning would identify a substantial retracement without estabshing that the entire breakout had failed. Holding this area and reversing upward would support a corrective interpretation; further penetration beneath it would weaken that reading.
The Traditional-scale breakdown and developing percentage-chart warning consequently describe different aspects of the same price action. The scan identifies a loss of support on its own scale; the percentage chart examines how much of the preceding advance the reaction is surrendering.
Additional bearish matches across industrial property, retail property and real-estate services on October 7–8 suggest weakness extending beyond WELL. Rising Treasury yields and technology-led strength supporting SPY provide a plausible backdrop to the sector’s relative deterioration, as discussed in MarketWatch’s October 8 analysis.
Repair requires more than an initial rebound. An X-column reversal in XLRE/SPY would interrupt the current relative decline. Recovery through 57.32 would regain the former floor, while a subsequent buy signal above the preceding X-column high would provide stronger evidence that relative demand had regained control. For WELL, buyers must demonstrate whether the highlighted breakout area can arrest the reaction. Until those responses develop, the evidence remains one of established sector underperformance accompanied by a substantial, but still developing, warning in its largest holding.