


This Week in Brief
Participation: Improved across every tracked index, but no universe reached majority X-column participation.
Fresh signals: Early-week supply pressure moderated sharply, yet Friday still finished 29 bullish to 34 bearish.
Leadership: Energy and Health Care remained strong, while broader sector participation stayed uneven.
Friday verdict: Improvement was real, but the evidence did not meet the threshold for a confirmed setup.
The week closed with a market that looked better underneath than it did one week earlier, but not yet strong enough to call the improvement broad or structurally complete.
Point & Figure participation improved across every major U.S. universe tracked by Zerblix. At the same time, none finished with a majority of constituents in X columns. Fresh U.S. signals also ended Friday slightly tilted toward new supply, sector breadth remained sharply uneven, and a powerful burst of broad ETF leadership seen during Thursday's Daily Monitoring contracted substantially into the official Friday close.
That combination matters. Demand did improve. It simply did not produce the cross-confirmation required to promote the move into a stronger weekly conclusion.
1. Official Friday X-Column Participation
August 28 vs. September 4, 2026
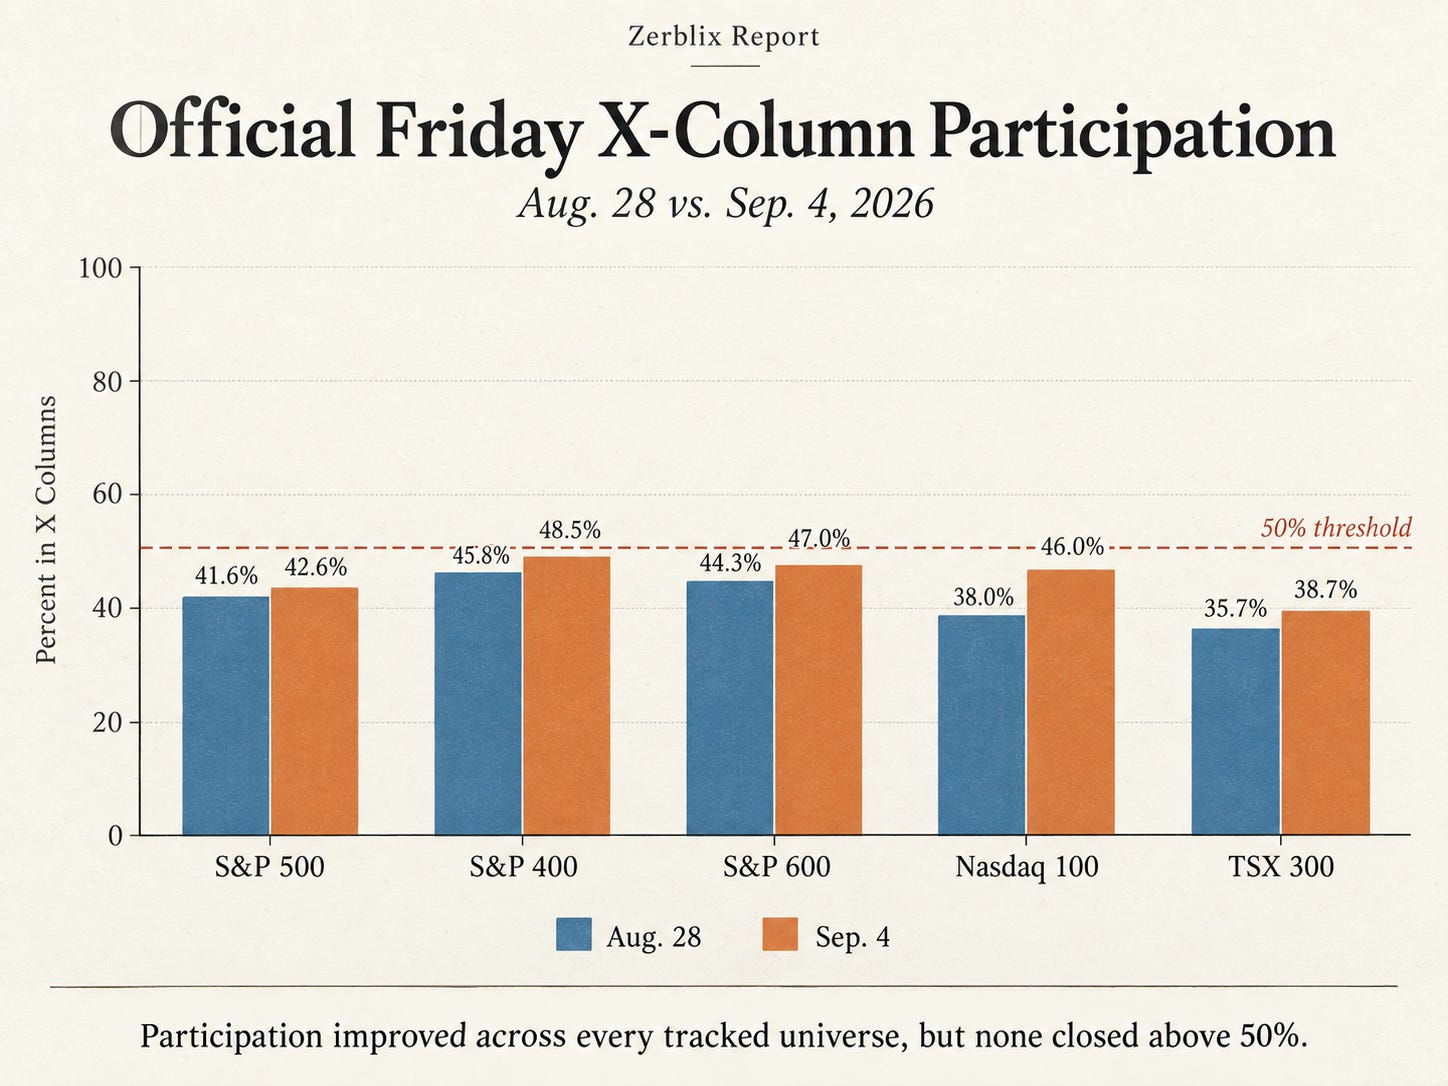
Friday's X-column readings improved across all four tracked U.S. equity universes:
S&P 500: 213 of 500, or 42.6%, up from 41.6% the prior Friday.
S&P 400: 194 of 400, or 48.5%, up from 45.8%.
S&P 600: 282 of 600, or 47.0%, up from 44.3%.
Nasdaq 100: 46 of 100, or 46.0%, up from 38.0%.
The improvement was therefore not isolated to a single capitalization tier. Large caps, mid caps, small caps and the Nasdaq 100 all gained X-column participation during the week.
That is constructive from a demand-versus-supply perspective. More stocks ended the week advancing on their P&F charts than one week earlier.
The limitation is equally important: none of the four U.S. universes exceeded 50%.
Mid caps came closest at 48.5%, followed by small caps at 47.0% and the Nasdaq 100 at 46.0%. The S&P 500 remained lower at 42.6%.
So the Friday evidence is better described as improving participation inside an unresolved structure than as broad confirmation. A stronger follow-through would require the improvement to survive and push a larger share of these universes into X columns rather than merely rebound from depressed participation.
2. New Demand Recovered During the Week — Then Lost the Friday Advantage
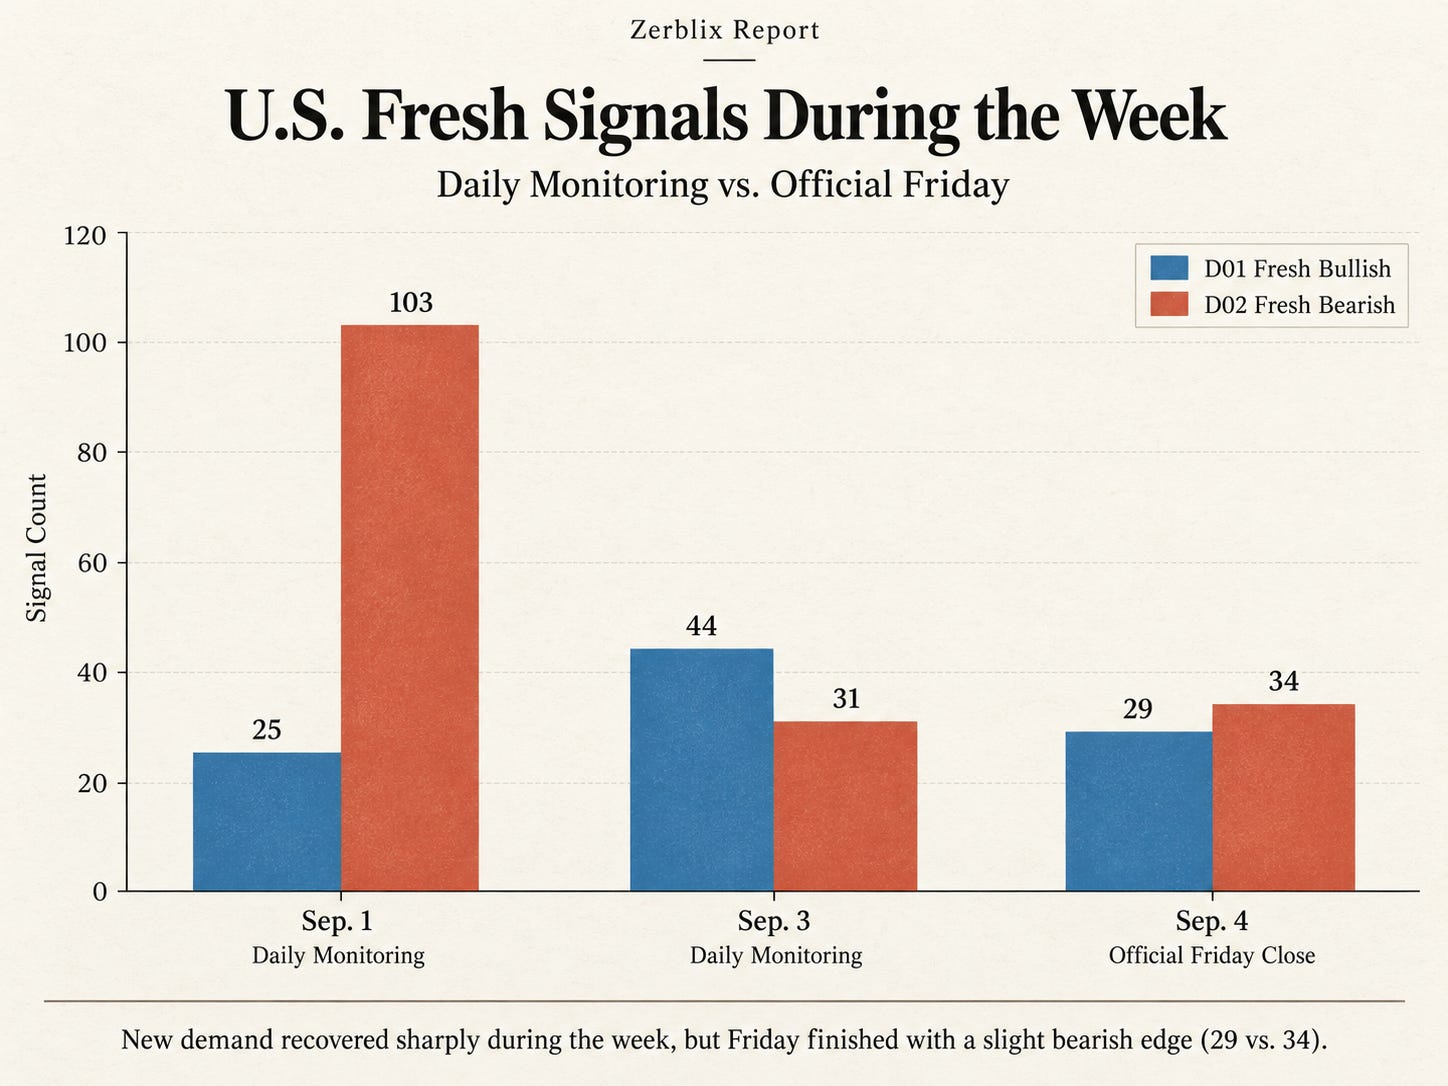
The fresh-signal sequence illustrates why Friday confirmation remains central to the Zerblix process.
Earlier in the week, supply had been dominant. On September 1, the U.S. fresh-signal scans recorded 25 bullish Double Top Breakouts against 103 bearish Double Bottom Breakdowns, a net reading of -78.
By Thursday, that imbalance had reversed sharply. Daily Monitoring recorded 44 fresh bullish signals versus 31 fresh bearish signals, producing a +13 net demand advantage.
Friday did not completely reject that recovery, but it did fail to confirm Thursday’s bullish imbalance. The official close produced:
29 fresh bullish signals versus 34 fresh bearish signals — net -5.
That is a much healthier balance than Tuesday’s -78, but it also shows why improvement during the week should not be confused with an official weekly conclusion. Friday’s close remains the benchmark for determining whether that improvement developed into structural confirmation.
Demand recovered strongly enough to reduce the week’s earlier supply pressure. It did not finish Friday in control of the fresh-signal count.
The practical interpretation is therefore neither “the breakdown continued unchanged” nor “the market turned broadly bullish.” Friday left a more nuanced condition: the deterioration moderated, participation improved, but fresh supply retained a narrow edge at the authoritative close.
3. Sector Breadth Remained Highly Uneven
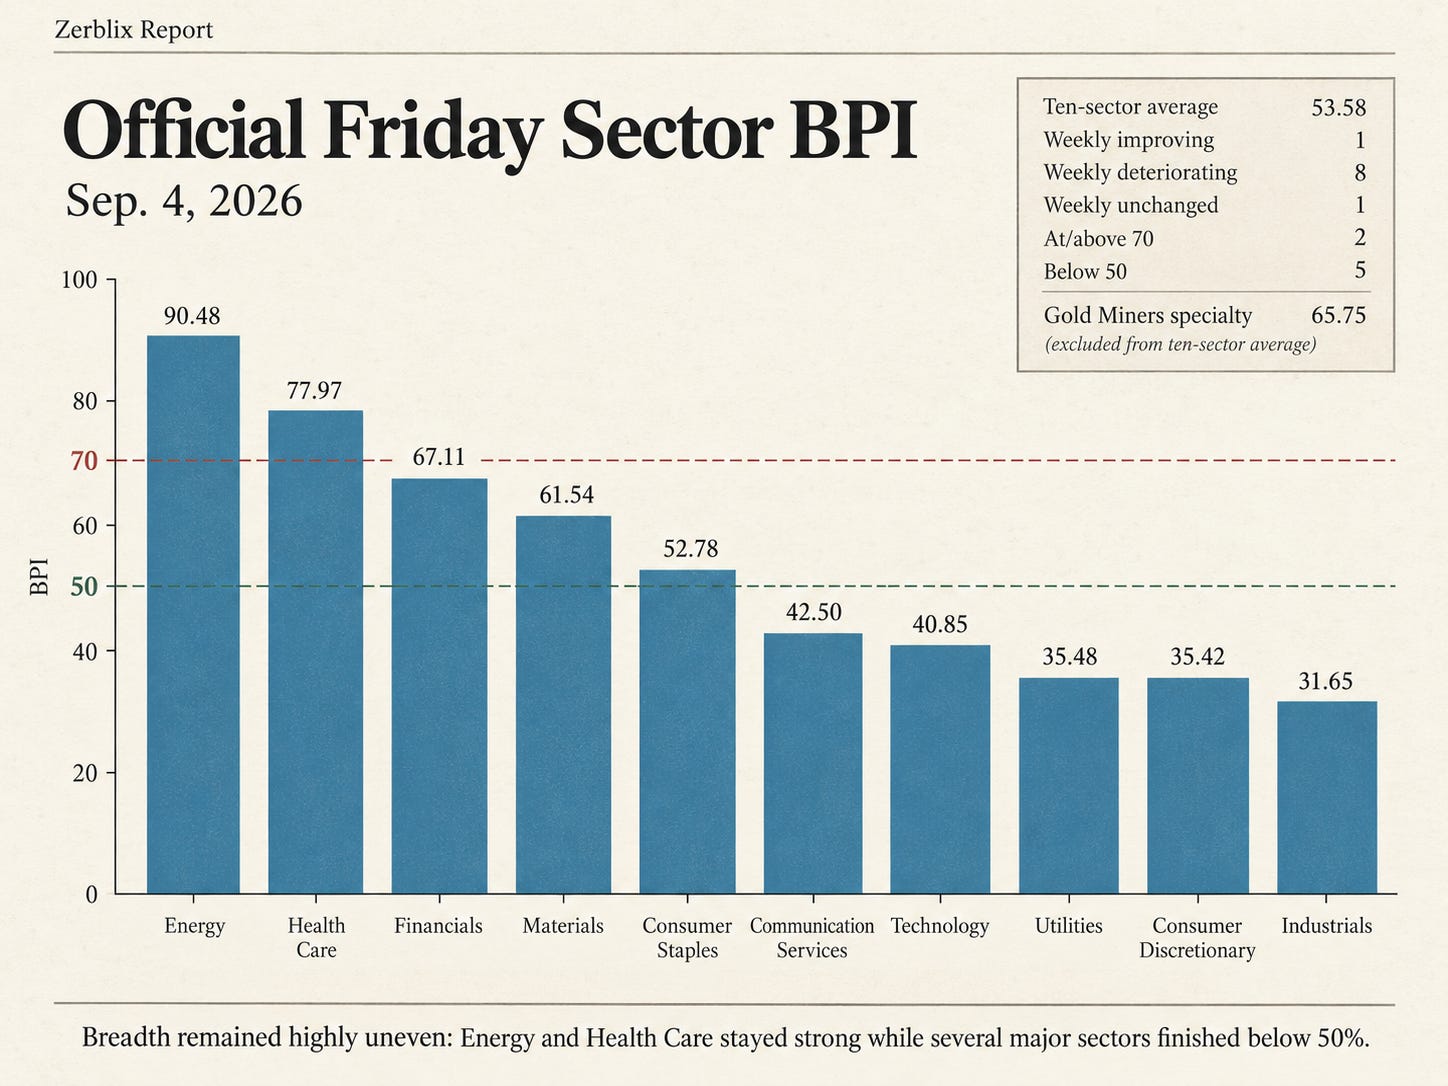
The sector layer provides another reason not to treat the rebound as broad confirmation.
Across the ten standard Zerblix sector Bullish Percent Indexes (BPI), the average declined from 61.25% on August 28 to 53.58% on September 4, a drop of roughly 7.7 percentage points.
The deterioration was broad rather than isolated. Eight of the ten sectors weakened week over week, only one improved, and one was unchanged. By Friday’s close, five of the ten sectors were below the 50% level, indicating that internal participation had weakened across a substantial portion of the sector structure.
The internal spread was substantial.
Energy remained the clear breadth leader at 90.48%, advancing 9.53 points from the prior Friday. Health Care remained structurally strong at 77.97%.
Elsewhere the picture was considerably weaker:
Financials: 67.11%
Materials: 61.54%
Consumer Staples: 52.78%
Communication Services: 42.50%
Technology: 40.85%
Consumer Discretionary: 35.42%
Utilities: 35.48%
Industrials: 31.65%
Technology fell 15.49 percentage points from the previous Friday, Consumer Discretionary fell 18.75 points, Industrials fell 16.45 points and Consumer Staples fell 19.44 points.
This is not the profile of uniformly expanding risk appetite.
Instead, the market continues to show leadership concentration alongside improving index participation. Energy and Health Care remain strong pockets, while several economically and growth-sensitive areas continue to carry much weaker internal breadth.
That contradiction is important. A broad market advance becomes more durable when rising participation is reinforced across sectors rather than carried by a relatively limited number of stronger groups.
Selective Leadership Inside Weak Technology Breadth
4. ETF Leadership Flared Midweek, but Friday Cut the List Back
The broad ETF scans produced one of the clearest examples of why Daily Monitoring and official Friday confirmation must remain separate.
On Thursday, R01 expanded sharply, signaling a broad increase in ETF leadership during the session. That improvement was meaningful as an early-warning development, but it did not survive into Friday at comparable scale
By the official Friday close, broad ETF leadership had contracted substantially. At the same time, eligible broad ETF weakness remained limited after Zerblix exclusions were applied.
The implication is straightforward: Thursday’s expansion showed that demand was capable of broadening, but Friday did not confirm that expansion as a durable weekly leadership shift.
That does not erase the midweek improvement. It lowers its confirmation status.
A stronger future signal would require eligible R01 leadership to expand again, persist through Friday, and receive support from improving X-column participation, sector breadth, relative strength and leadership persistence.
5. Macro Leadership Offered No Fresh Friday Confirmation
The locked 24-ETF macro universe was unusually quiet at the official close.
All six F-series scans finished Friday at confirmed zero:
no fresh macro Double Top Breakouts,
no fresh macro Double Bottom Breakdowns,
no qualifying 52-week major leaders,
no qualifying 52-week major weakness,
no qualifying 3-month emerging leaders,
and no qualifying 3-month emerging weakness.
These were processed zeros, not missing scans.
That result is particularly useful because DBC had appeared on Thursday as both the sole 52-week major leader and the sole 3-month emerging leader. Neither condition remained on the Friday scan.
The cross-asset message therefore remained muted. There was no new Friday macro signal strong enough to provide independent confirmation of a major change in equity regime.
Financial stress also remained subdued. The latest verified FRED STLFSI4 observation, dated August 28, was −0.8526, still below the index’s zero reference and consistent with below-average financial-market stress rather than an acute stress regime.
Low systemic stress, however, is not the same thing as broad equity confirmation. It removes one potential source of contradiction without supplying the missing participation and leadership confirmation on its own.
6. Canada: Stronger Participation, but Fresh Supply Still Led
Canada shared part of the U.S. improvement in participation, but the internal picture remained mixed.
The S&P/TSX 300 finished with 116 of 300 stocks in X columns, or 38.67%, up from 35.67% the previous Friday.
That is improvement, but the level remains considerably below a majority.
Fresh Canadian signals also leaned bearish at the official close. T01 recorded one fresh bullish Double Top Breakout, while T02 recorded three fresh bearish Double Bottom Breakdowns.
The Canadian structure therefore resembles the broader weekly theme: participation improved, but new demand did not yet dominate Friday's fresh-signal flow.
This should continue to be evaluated alongside the established strength previously observed in Canadian Energy and Materials rather than assuming the TSX is moving as a single uniform market.
7. The Friday Decision: Improvement Without a Confirmed Setup
Taken together, the evidence points to a market that improved during the week but did not complete the transition into broad structural confirmation.
First, participation improved. Every tracked U.S. index recorded a higher X-column percentage, and Canadian participation improved as well.
Second, that improvement remained incomplete. No tracked U.S. index reached 50% X-column participation, and the TSX remained below 40%.
Third, fresh supply narrowly exceeded fresh demand on Friday. The U.S. finished with 29 fresh bullish signals versus 34 fresh bearish signals, while Canada finished with one bullish signal versus three bearish.
Fourth, sector breadth remained fractured. Energy and Health Care were strong, but half of the ten standard sector BPIs finished below 50%, and eight deteriorated from the prior Friday.
Fifth, Thursday’s ETF leadership surge did not receive equivalent Friday confirmation. Broad leadership contracted sharply into the official close.
The practical conclusion is that the week showed meaningful improvement without broad confirmation. Demand strengthened enough to challenge the earlier deterioration, but the evidence was still too uneven to describe the move as a fully established risk-on shift.
Week Ahead: What Would Change the Evidence?
The first condition to watch is whether the X-column rebound continues. The most constructive development would be several U.S. universes moving decisively above 50%, particularly if the improvement broadens rather than remaining concentrated.
Second, fresh bullish signals need to regain the advantage and persist. Thursday demonstrated that demand can reappear quickly; Friday demonstrated that a one-session surge is not enough. A sustained positive D01-minus-D02 balance would strengthen the evidence considerably.
Third, sector breadth needs broader sponsorship. Energy can remain strong without carrying the entire market. Improvement in Technology, Industrials, Consumer Discretionary and other currently weak breadth groups would make the participation rebound more credible.
Fourth, ETF leadership needs persistence. Another large R01 expansion would be more significant if eligible leadership survives through Friday rather than collapsing from a weekday spike.
Fifth, new setups require convergence. Fresh signals should be reinforced where possible by Pattern Pressure, BPI, X-column participation, 4W/13W/26W relative strength, leadership persistence and chart follow-through.
Until those layers begin agreeing more consistently, the market remains in a transition zone: demand has improved enough to challenge the deterioration, but not enough to establish broad structural control.
Reader Reference
X-column Participation — The percentage of securities in a universe currently rising in X columns on their Point & Figure charts. It measures immediate demand-versus-supply participation.
Bullish Percent Index (BPI) — The percentage of securities in a universe carrying Point & Figure buy signals.
Pattern Pressure — The Zerblix-defined balance of selected bullish and bearish P&F patterns. It measures established structural pressure and is distinct from fresh signals, BPI and X-column participation.
Fresh signal — A newly appearing Double Top Breakout or Double Bottom Breakdown in the applicable fresh-signal scan.