


Zerblix P&F Market Breadth and Rotation — Week Ending October 16, 2026
Participation broadened during the week, but the improvement was uneven across the market. More stocks moved into rising Point & Figure columns, while energy and healthcare combined stronger price performance with expanding buy-signal participation. Technology deteriorated, and smaller-company ETFs continued to register weakness.
The developing question is whether the recovery in column direction can produce a more durable expansion in buy signals. Friday’s fresh signals offer support, but their survival through subsequent reactions remains the next test.
Rising columns show broader recovery; buy signals show incomplete repair
The S&P 500’s X-column participation increased from 53.20% to 71.60% between October 9 and October 16. Its Bullish Percent Index increased from 35.40% to 44.60%.
That distinction is central to the reading. A larger share of constituents occupied rising columns, but fewer than half held P&F buy signals.
X-column participation measures column direction. Bullish Percent Index (BPI) measures the percentage of a defined group retaining buy signals. A stock can reverse into Xs without exceeding the prior X-column high required to generate a new buy signal.
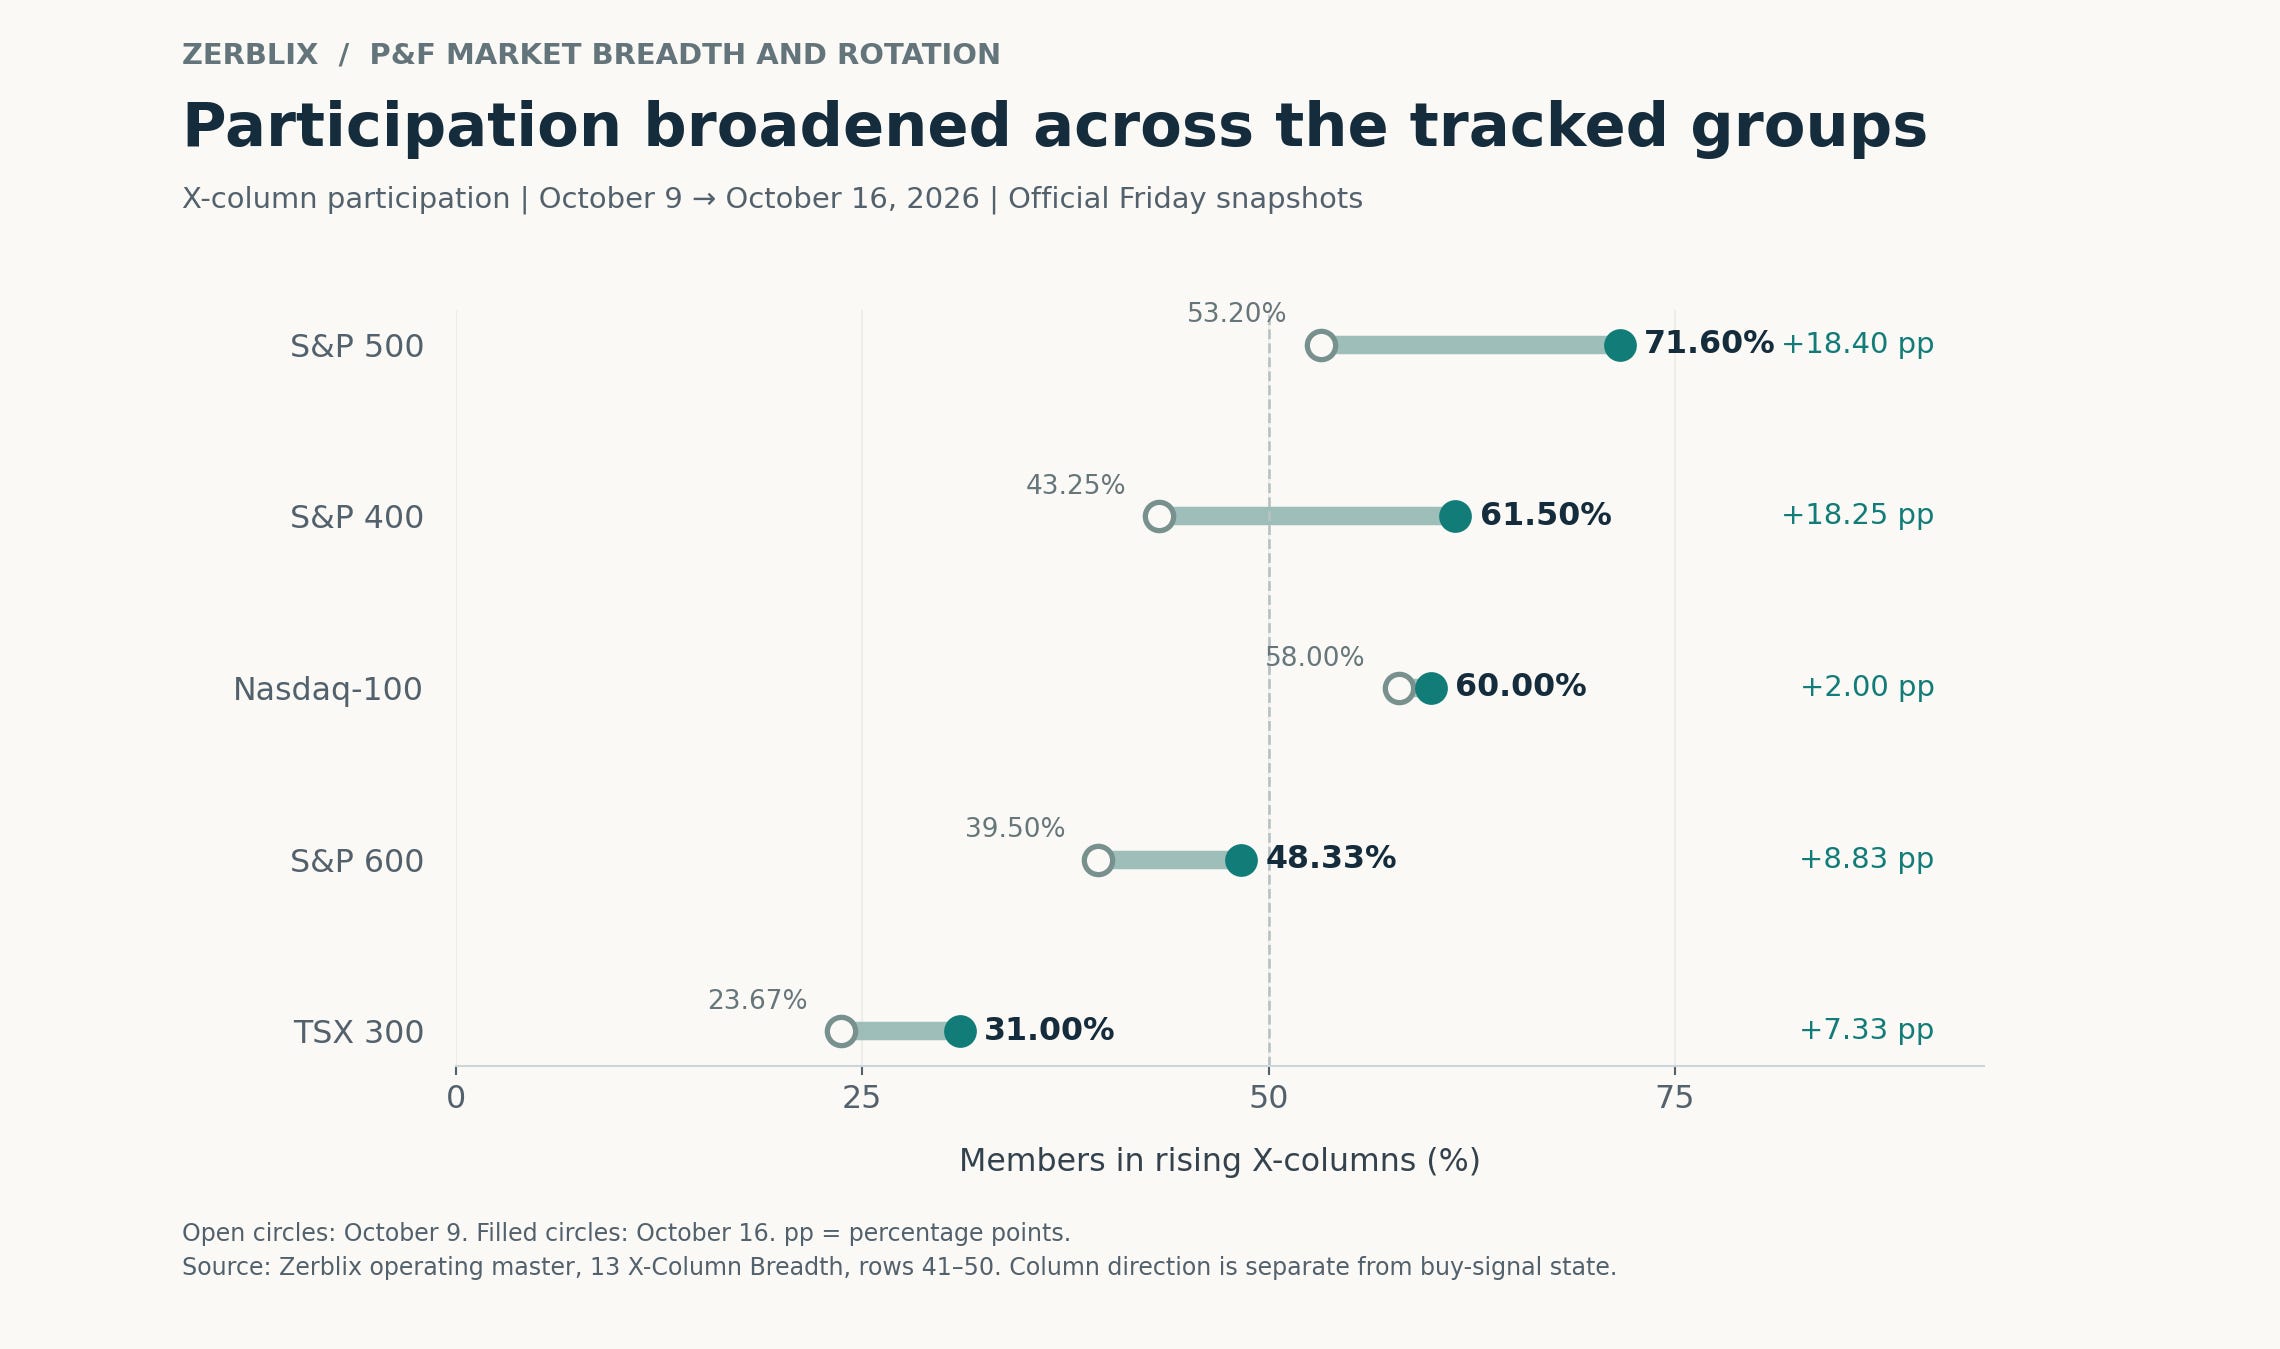
The improvement extended across all five tracked universes:
S&P 500: 71.60%, up 18.40 percentage points week over week.
S&P 400: 61.50%, up 18.25 points.
Nasdaq-100: 60.00%, up 2.00 points.
S&P 600: 48.33%, up 8.83 points.
TSX 300: 31.00%, up 7.33 points.
The expansion indicates that directional recovery reached beyond a narrow group of stocks. However, the S&P 600 and TSX readings remained below half of their tracked universes.
Demand has produced a broader recovery in column direction, while buy-signal participation still requires further repair. Continued participation through reactions, followed by additional buy signals, would strengthen that interpretation. A rapid contraction in rising columns would suggest that the recovery lacks durability.
Energy and healthcare retain the clearest alignment
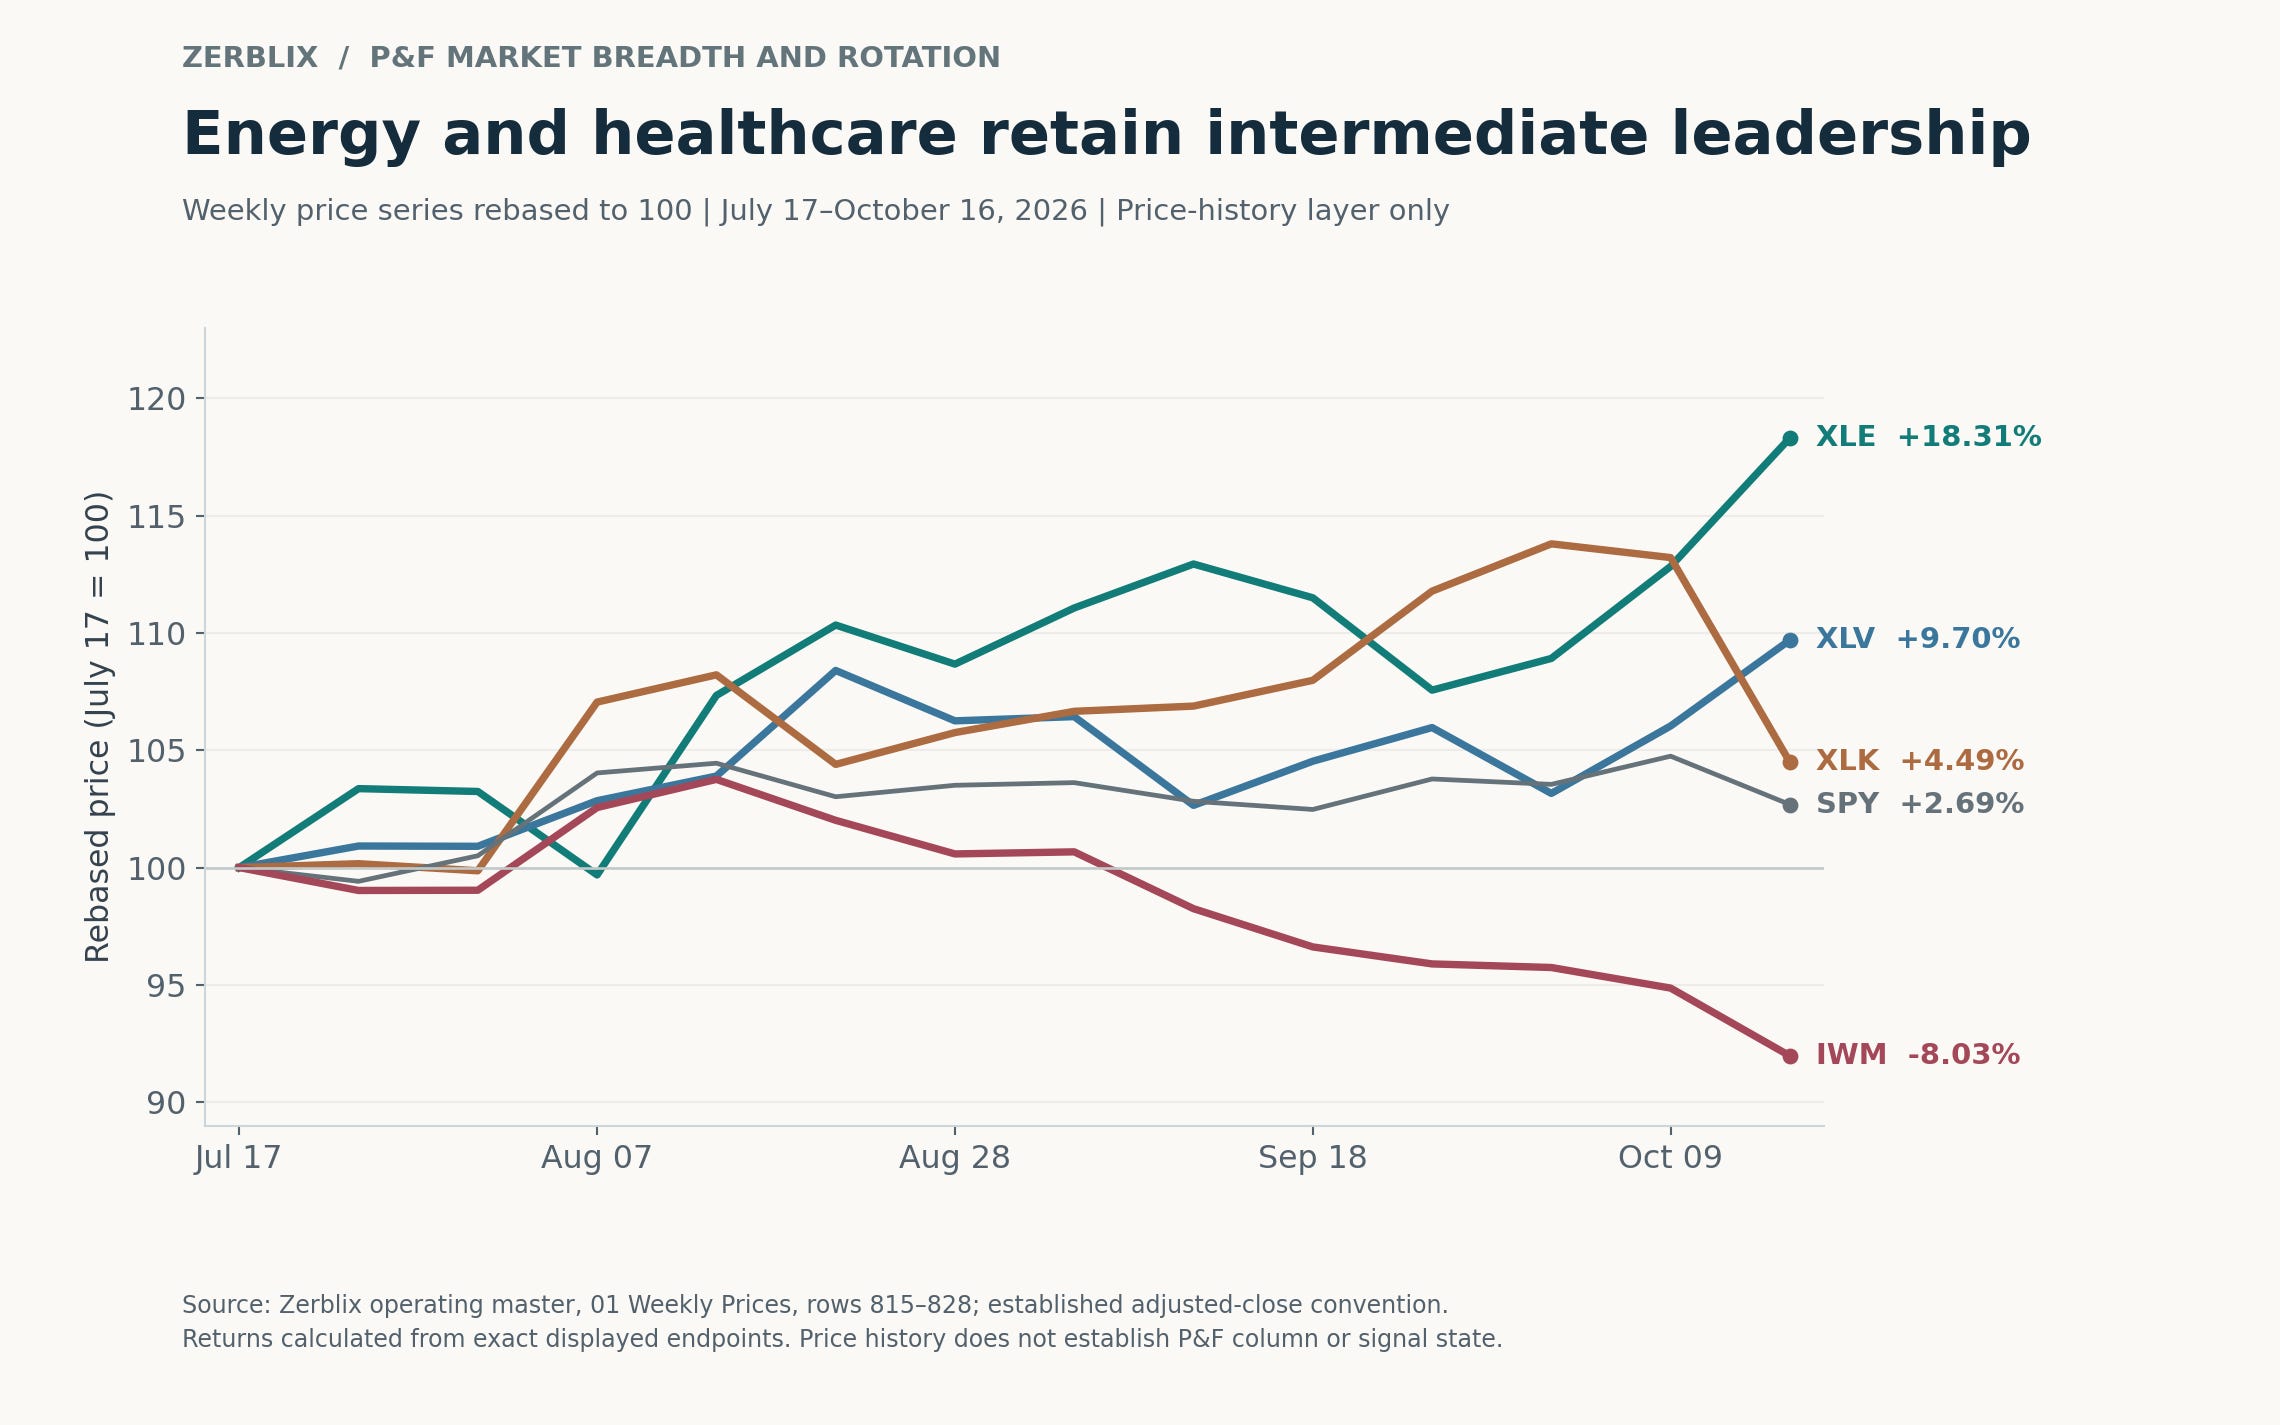
The intermediate price comparison provides context for the latest weekly changes. From July 17 to October 16, XLE advanced 18.31% and XLV gained 9.70%, compared with 2.69% for SPY.
Energy’s Bullish Percent Index (BPI) increased from 52.38% to 66.67% during October 9–16. The expansion in buy-signal participation accompanied an established price advantage.
XLE, IXC, IYE, VDE and FTXN appeared in the R01 Scan leadership screen. BNO and COMT extended the observation into oil and broader commodity exposure.
The leadership screen combines a new high relative to the preceding 63 sessions with an active P&F double-top condition. It identifies ETFs meeting both conditions, although the buy signal may have formed earlier. Several qualifying energy ETFs share underlying exposures, so their simultaneous appearance reinforces a concentrated energy theme rather than demonstrating strength across separate areas of the market.
EOG and FANG appeared in Friday’s fresh bullish stock scan. Canadian energy producers Baytex Energy (BTE.TO) and Paramount Resources (POU.TO) also generated fresh bullish breakouts on their traditional three-box reversal P&F charts on October 16. These examples connect broader energy strength with individual structures now requiring follow-through.
Healthcare’s BPI increased from 40.68% to 72.88% during October 9–16. IHF qualified for the leadership screen, while ISRG, CHE, COO and PODD appeared in Friday’s fresh bullish scan.
The sector also contained opposing signals. AZTA, BIO, INDV and KRYS appeared in the fresh bearish scan, showing that expanding aggregate buy-signal participation coexisted with individual deterioration. The improvement supports selective examination of stronger structures.
For both sectors, confirmation requires bullish signals to survive subsequent reactions and produce further upside progress while participation remains firm. Failed breakouts accompanied by declining BPI would weaken the alignment between individual demand and sector breadth.
Technology’s deterioration makes individual selection more demanding
XLK declined 7.70% during October 9–16, although it remained 4.49% above its July 17 close. The latest weakness reduced an earlier advance, making it important to distinguish the weekly deterioration from the intermediate price record.
Technology’s Bullish Percent Index (BPI) fell from 57.75% to 43.66%. Friday’s fresh scans recorded seven bullish technology memberships against nine bearish memberships.
LRCX, FTNT, OKTA and PLTR appeared in the bearish scan. IBM and NOW appeared in the bullish scan, while BOTZ qualified for R02.
The sector is showing meaningful internal dispersion. Selected bullish structures remain present, but they are developing against weaker aggregate buy-signal participation.
The practical test is whether those stronger charts can retain their signals while the sector rebuilds. Continued breakdown survival would reinforce deterioration. Failed bearish signals and renewed expansion in BPI would weaken the bearish interpretation.
Fresh signals support recovery outside technology
Friday’s U.S. fresh-signal scans recorded 65 bullish and 20 bearish memberships.
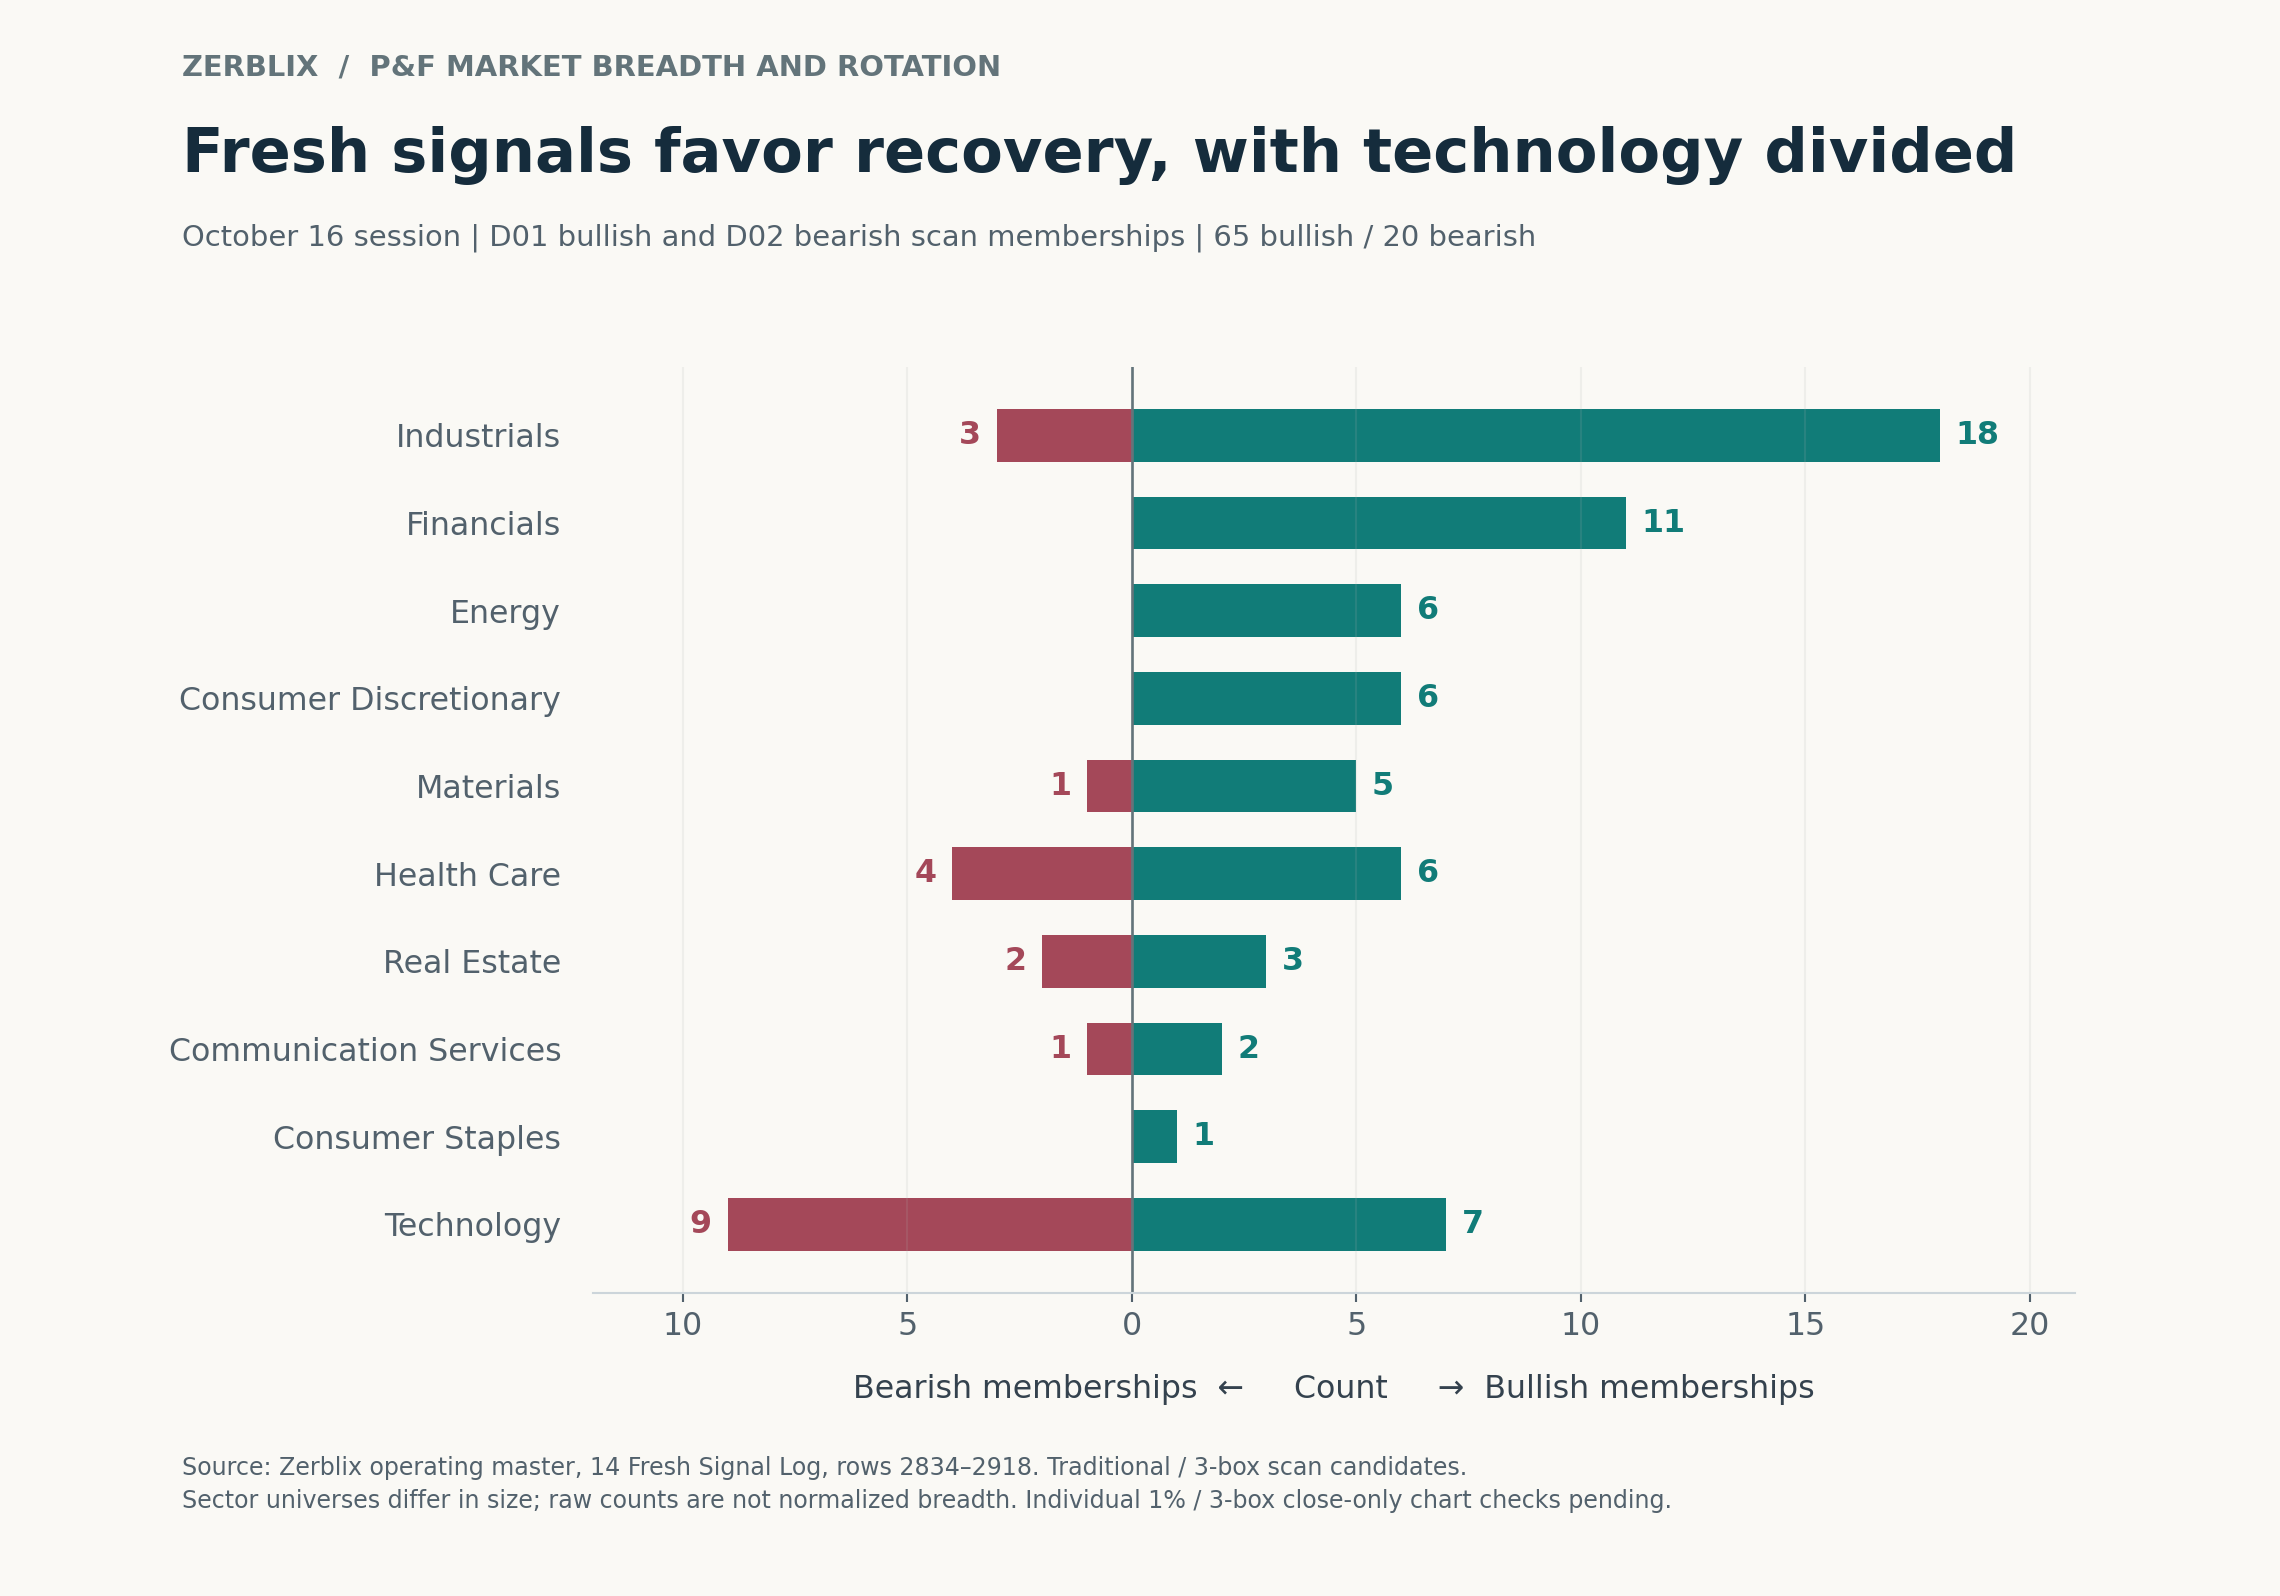
Industrials contributed 18 bullish versus three bearish memberships. Financials contributed 11 bullish and no bearish memberships in the submitted scans.
CMI and XPO provide industrial examples, while CME and ICE provide financial examples. Their significance comes from their place within the broader distribution: Friday’s bullish flow extended beyond the sectors already showing the strongest intermediate price performance.
These are session counts, not weekly totals. Sector universes also differ in size, so raw memberships should not be treated as normalized sector breadth rankings.
A fresh breakout establishes an initial observation. Its ability to hold, extend or fail determines whether it becomes evidence of sustained demand.
Small-cap weakness remains unresolved
S&P 600 X-column participation increased to 48.33%, but IWM remained in both F06 and R02 weakness screens. IWO, IWP, IJK and VBK also appeared in R02.
IWM remained 8.03% below its July 17 close.
The S&P 600 and Russell 2000 are different universes. Nevertheless, their comparison identifies an important tension: constituent direction has improved, while smaller-company ETF weakness persists.
Confirmation would require that participation improvement to endure alongside structural repair in the ETFs. Without that follow-through, the rising-column recovery remains vulnerable to another expansion in supply.
Commodity strength remains selective
DBC gained 16.43% from July 17 to October 16, but the latest weekly results showed considerable variation:
DBC: increased 2.37%.
GLD: declined 0.67%.
SLV: declined 5.97%.
The stronger energy-related evidence therefore should not be generalized into strength across all commodities. Oil-related exposure, broad commodity exposure and precious metals are delivering different messages.
These returns provide cross-asset context. They do not establish the ETFs’ P&F signal states or explain the economic cause of the rotation.
What matters next
The recovery would gain support if rising-column participation holds through reactions, BPI continues expanding, and fresh bullish signals survive outside the established leadership groups.
Energy and healthcare provide the clearest examples of price and participation working together. Technology and small-cap ETFs provide the more demanding tests of whether the broader market can repair its weaker areas.
A retreat in X-column participation, failed bullish signals and expanding breakdowns would weaken the recovery thesis. Until those outcomes develop, the evidence supports broader directional improvement within an uneven leadership structure.
Investing involves risk, including loss of principal. Conduct your own research and consider your financial circumstances before investing.