


The broad market finished the week with better participation beneath the surface, but the more important development was not a uniform expansion of risk appetite. It was the growing separation between established leaders.
Technology and Energy remain two of the strongest intermediate price trends among the major U.S. sectors. Friday's evidence, however, showed them moving in very different internal directions.
Technology gains confirmation as Energy loses it
Technology remains the strongest complete sector configuration in the current board. XLK sits at the top of its 52-week range and maintains positive relative strength versus SPY across the one-week, one-month and three-month horizons. Technology Bullish Percent Index (BPI) 1 rose to 59.15, up 14.08 percentage points from the prior Friday, while Pattern Pressure2 improved by roughly 12 points.
The supply-and-demand interpretation is constructive: an established price leader is receiving stronger confirmation from participation and pattern structure.
Energy presents the opposite internal configuration. XLE still has strong three-month relative strength and substantial 12-month and YTD price leadership, so the intermediate trend has not simply disappeared. But its one-month and one-week relative strength (RS) turned negative, Bullish Percent Index (BPI) fell from 71.43 to 38.10, and Pattern Pressure deteriorated by roughly 67 points. Six Energy names also appeared among Friday’s fresh bearish D02 signals.
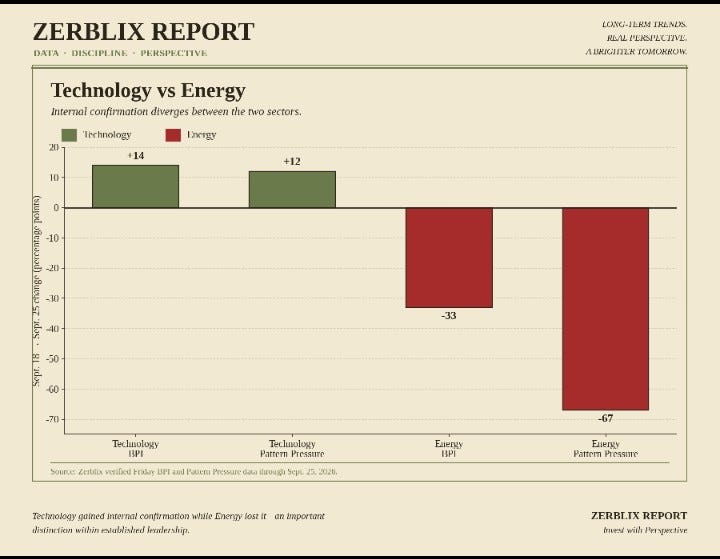
The distinction is important. Technology is Leading / Confirming. Energy remains Leading / Losing Momentum. Energy would require further deterioration in its intermediate relative trend before the longer leadership thesis itself is invalidated.
The broader sector rotation supports that distinction
The relative-strength map makes the separation clearer.
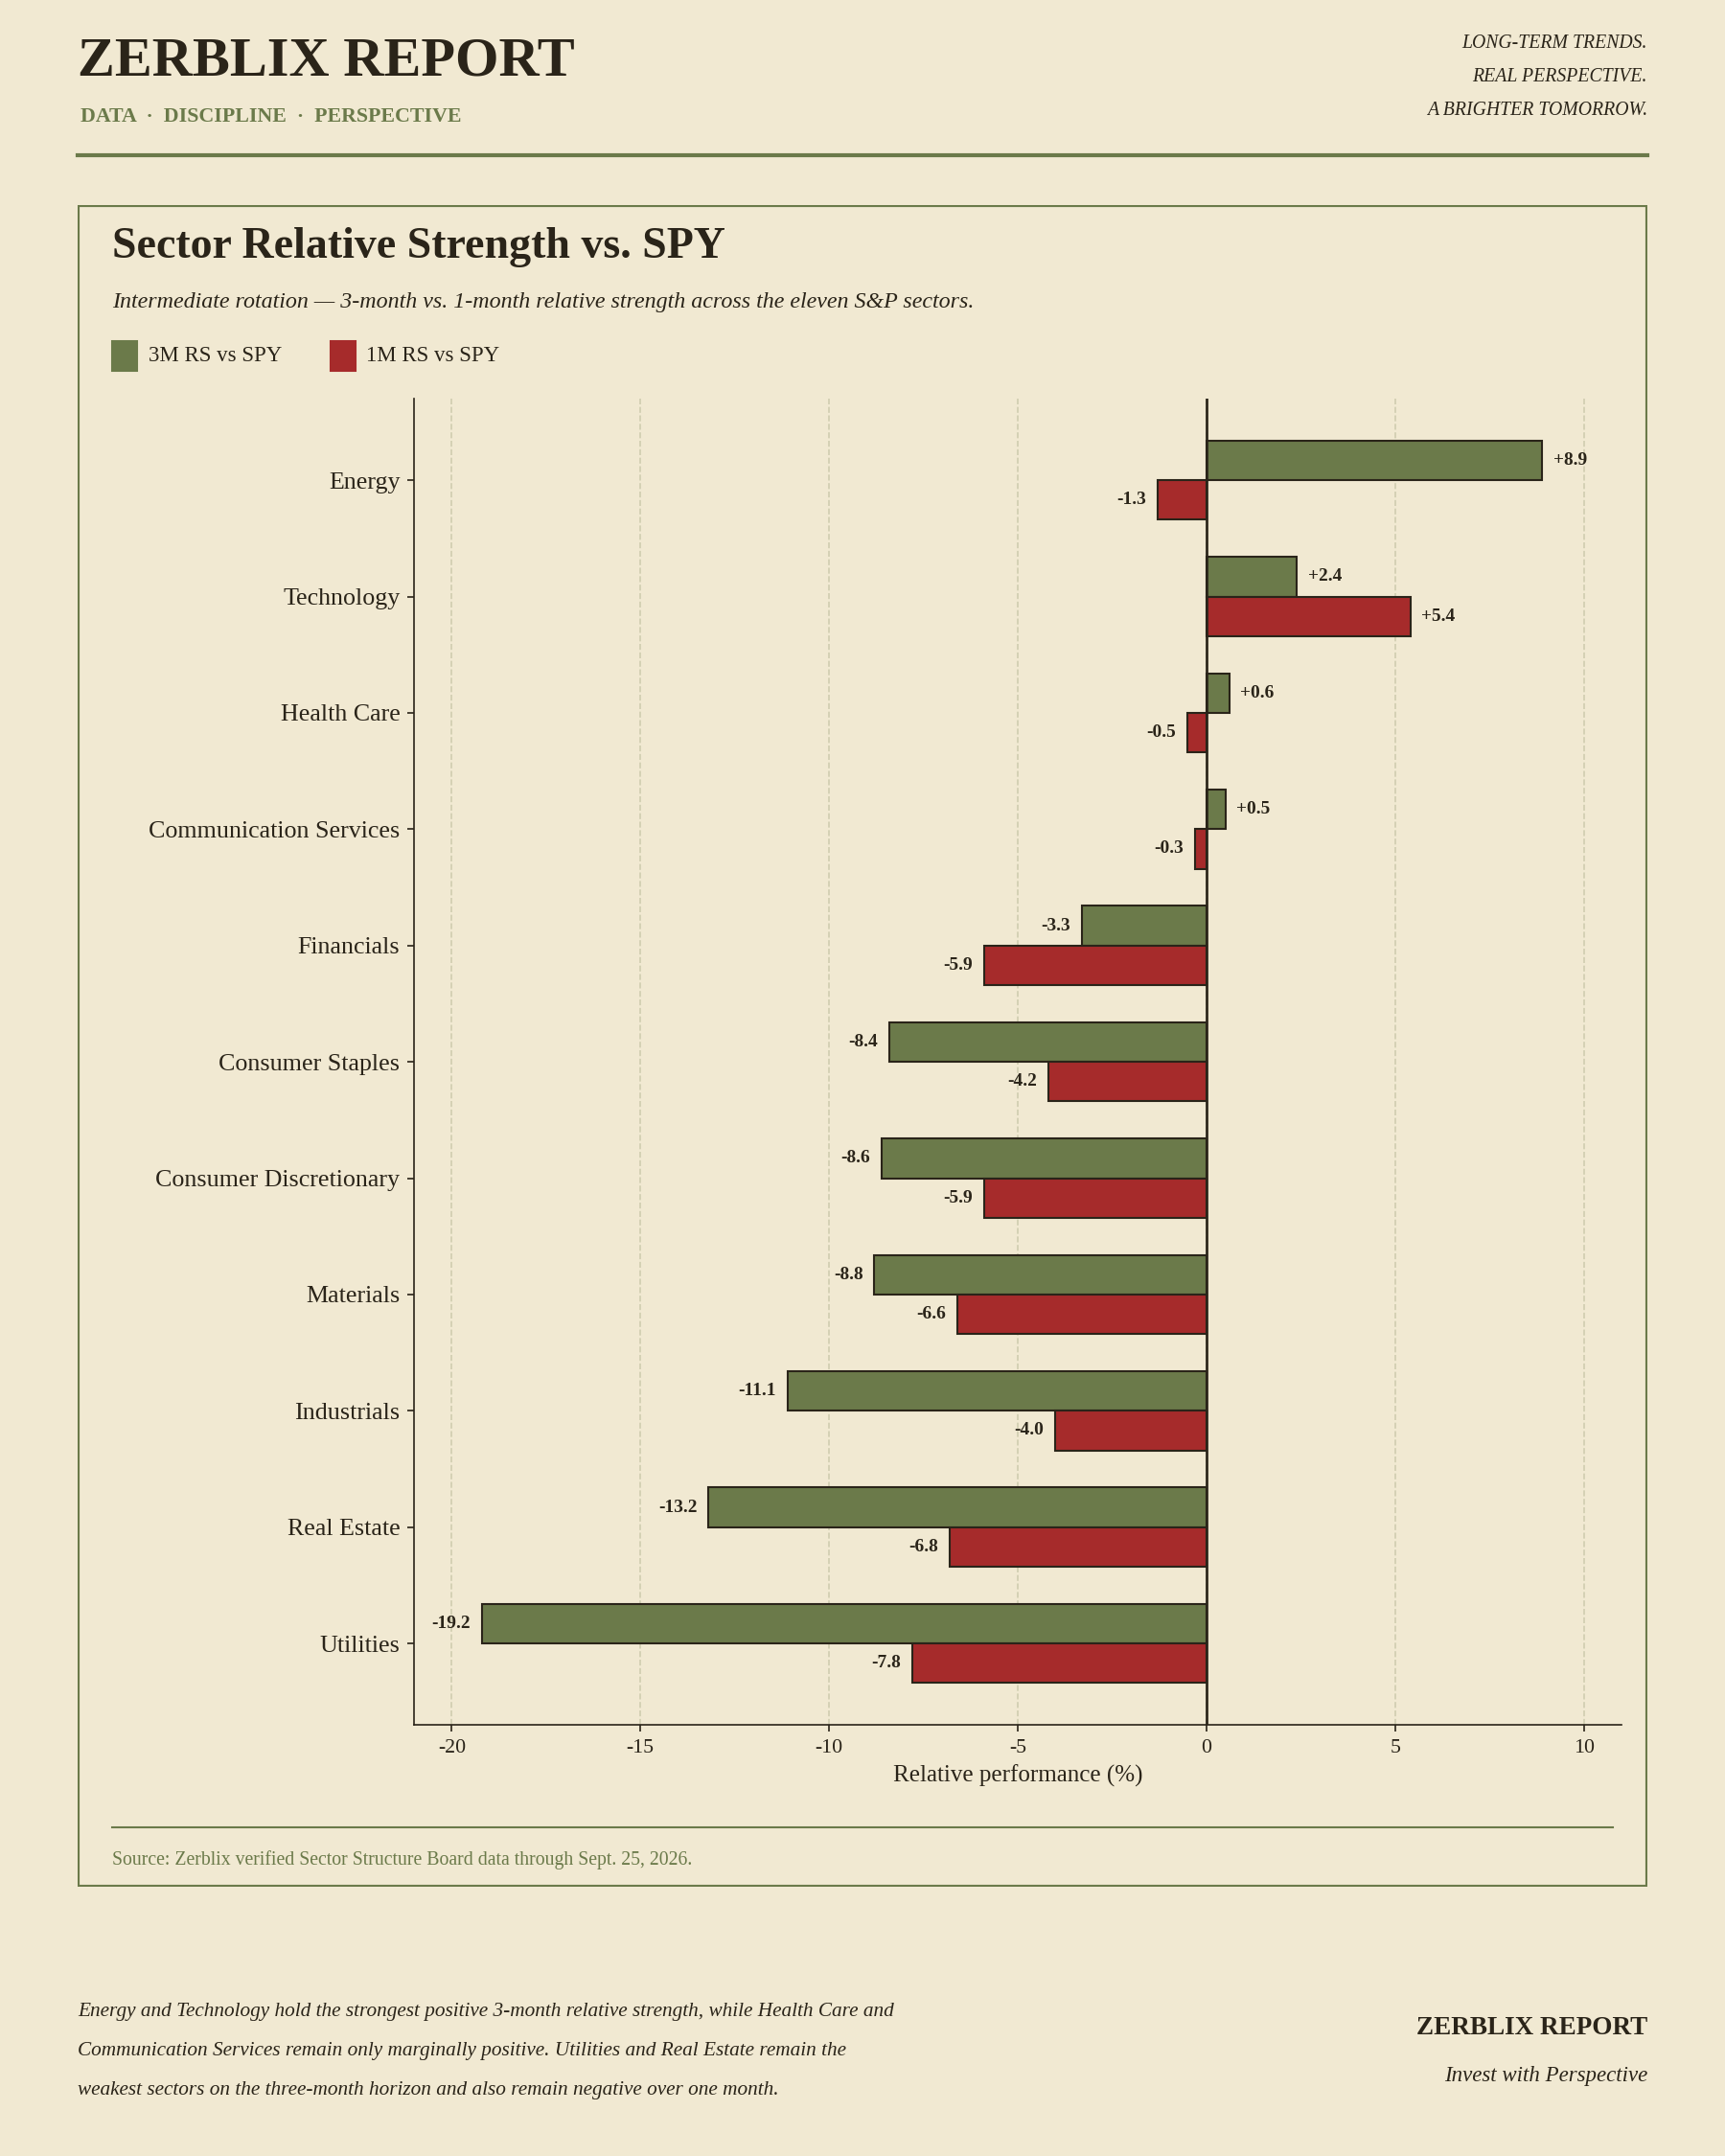
Energy still has the strongest three-month relative strength versus SPY, but its one-month reading has turned negative. Technology, by contrast, maintains positive relative strength across both the one-month and three-month windows. Health Care and Communication Services remain close to neutral-positive intermediate relative strength, while much of the remaining sector complex continues to lag the benchmark.
Utilities, Real Estate and Industrials remain especially weak on the three-month comparison. Financials, Materials, Consumer Staples and Consumer Discretionary also remain negative versus SPY over the intermediate horizon.
This is why Friday’s sector picture is better described as selective leadership rather than broad sector rotation.
Energy still leads on the three-month relative-strength horizon, but its one-month Relative Strength (RS) has turned negative. Technology, by contrast, remains positive across both the one-month and three-month windows. Health Care and Communication Services remain only marginally positive over three months, while most other major sectors continue to trail SPY.
Nasdaq participation catches up with price leadership
The strongest index-level confirmation came from the Nasdaq-100.
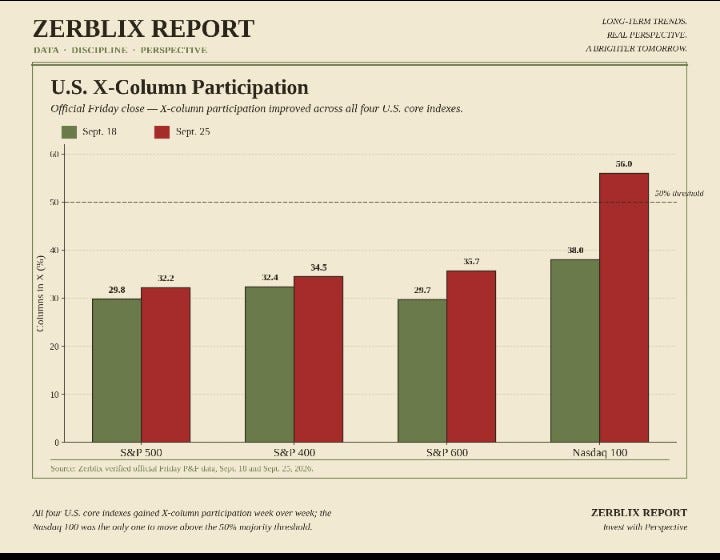
X-column3 participation rose from 38.0% to 56.0%, moving above the 50% majority threshold. Nasdaq-100 BPI also increased from 35.64 to 44.55, while Pattern Pressure improved materially from −28.77 to −1.45.
QQQ was already an established intermediate price leader. Friday therefore did not initiate Nasdaq leadership. Instead, a greater share of the underlying index began participating in the advance.
From a supply-and-demand perspective, that is an important improvement. Leadership supported by broader participation is structurally stronger than leadership carried by a narrow group of securities.
Breadth improved elsewhere, but majority participation remains absent
The improvement was not limited to the Nasdaq-100.
S&P 500 X-column participation increased from 29.8% to 32.2%. The S&P 400 rose from 32.5% to 34.5%, while the S&P 600 advanced from 29.7% to 35.7%.
All four U.S. core indexes therefore improved week over week. The distinction is that only the Nasdaq-100 finished above the 50% majority threshold.
The S&P universes are showing repair, but not yet broad majority participation.
Fresh demand is improving faster than older structure is repairing
Friday’s fresh U.S. Point & Figure signals leaned bullish, with 47 new bullish signals against 29 bearish signals.
That is evidence that current demand improved.
Established pattern prevalence, however, remains more cautious. Triple Bottom versus Triple Top counts remain bearish-skewed in the S&P 500, S&P 400 and S&P 600, while the Nasdaq-100 is balanced at two versus two.
This is not contradictory.
Fresh signals identify what is occurring now. Established pattern prevalence reflects structural damage accumulated over a longer interval. The combination suggests improving current demand against a market structure that has not yet fully repaired.
Long-duration weakness remains one of the cleaner trends
The 2% Point & Figure chart keeps TLT’s intermediate structure in perspective. Price remains in a declining sequence and has returned to a support area that was tested repeatedly during 2024 and 2025.
The current O-column is pressing against a cluster of prior lows from those two years. Because several earlier declines terminated in roughly the same area, the chart is developing the structure of a potential Quadruple Bottom Breakdown. Confirmation would require price to move below the lowest of the relevant prior O-column lows.
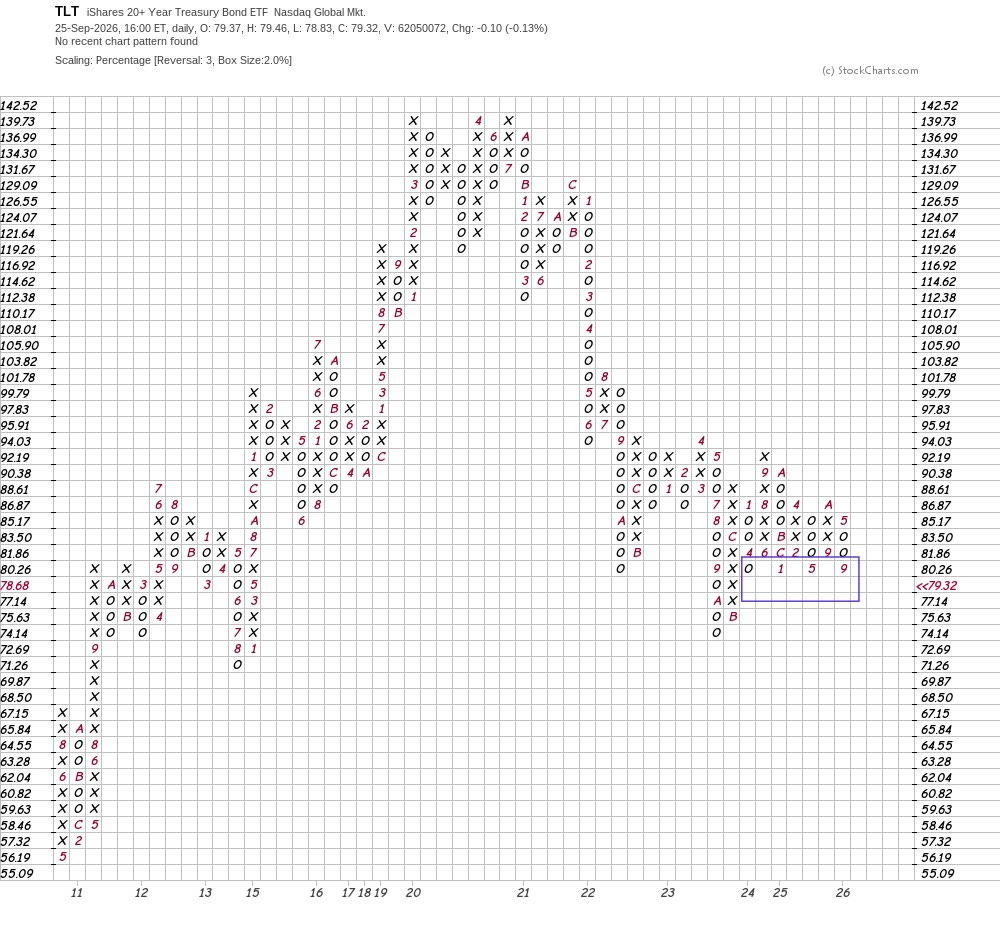
From a supply-and-demand standpoint, each prior low marks an area where demand previously absorbed enough selling pressure to halt the decline. A break beneath that repeated support would indicate that supply had finally overcome those prior demand zones and would strengthen the existing bearish structure. Until that occurs, the chart is better described as a retest of 2024–2025 support with a potential bearish breakdown forming, rather than as a completed Quadruple Bottom Breakdown.
TLT remains in Zerblix’s 52-week Major Weakness scan and the 3-month Emerging Weakness group, so the P&F chart is confirming an established area of weakness rather than introducing a new bearish thesis.
Practical interpretation: TLT remains Lagging / Confirmed Weakness. A decisive break beneath the 2024–2025 support lows would add a new bearish structural confirmation. A reversal into X’s from this area would show renewed demand and would weaken the immediate breakdown setup.
The weekly map
The intermediate picture entering the new week is increasingly differentiated.
Technology leadership is confirming. Energy leadership remains intact but is losing momentum internally. Nasdaq participation has broadened materially. Broader S&P participation is repairing but remains below majority. Older bearish P&F structure has not completely cleared. Long duration remains under supply.
That is a healthier internal picture than a week ago—but it is not uniform confirmation.
For intermediate traders and investors, the more useful question is no longer simply whether the market is strong.
It is where price leadership and internal participation still agree—and where that agreement is beginning to break down.
BPI — Bullish Percent Index: A Point & Figure breadth measure showing the percentage of securities in a group that are on active P&F buy signals.
Pattern Pressure: A Zerblix P&F measure comparing the balance of bullish versus bearish pattern evidence within a group. Positive readings indicate greater bullish pattern pressure; negative readings indicate greater bearish pattern pressure.
X-Column Participation: The percentage of securities in a group currently in an X-column on their Point & Figure charts, indicating the share presently advancing in P&F terms.