


Welcome to the first issue of Zerblix Report. Each week, we examine market structure through Point & Figure breadth, relative strength and risk relationships. These measures are most useful when read together. Price identifies the prevailing structure; breadth reveals how widely demand is distributed; relative strength shows where sponsorship is being concentrated. The purpose is not to forecast every turn, but to determine whether leadership is expanding, whether participation is confirming and what subsequent action would weaken the interpretation.
The first official reading presents a divided market. Leadership remains visible, financial stress is low and several intermediate relative-strength relationships are constructive. Beneath that surface, however, fewer securities are advancing in P&F X columns and newly emerging bearish signals have expanded. Demand has not disappeared, but it has become more selective while supply is pressing a broader portion of the market.
Leadership has not failed. Breadth has yet to confirm it.
The Weekly Conclusion
The market’s present condition is best described as selective leadership under deteriorating participation. Established leaders continue to carry the indexes, but the internal structure shows that the advance is drawing support from a smaller body of securities.
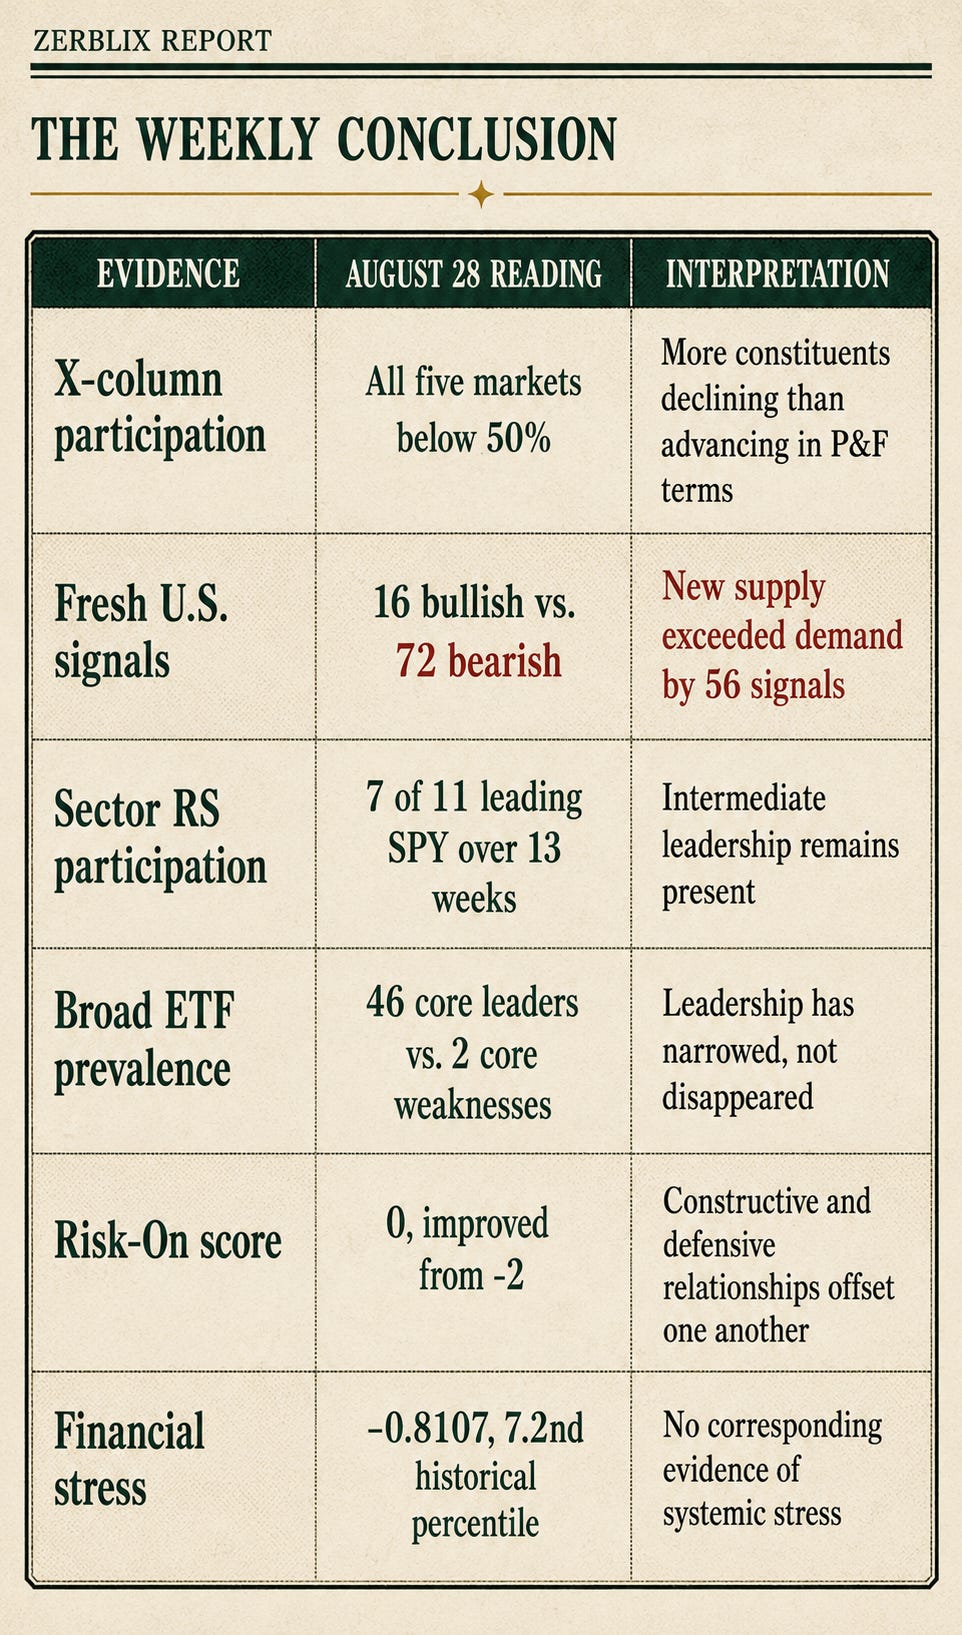
Editor’s Verdict: An index can remain resilient while fewer of its components participate. That condition can persist, but it becomes increasingly dependent on the remaining leaders.
Breadth Lost Its Majority
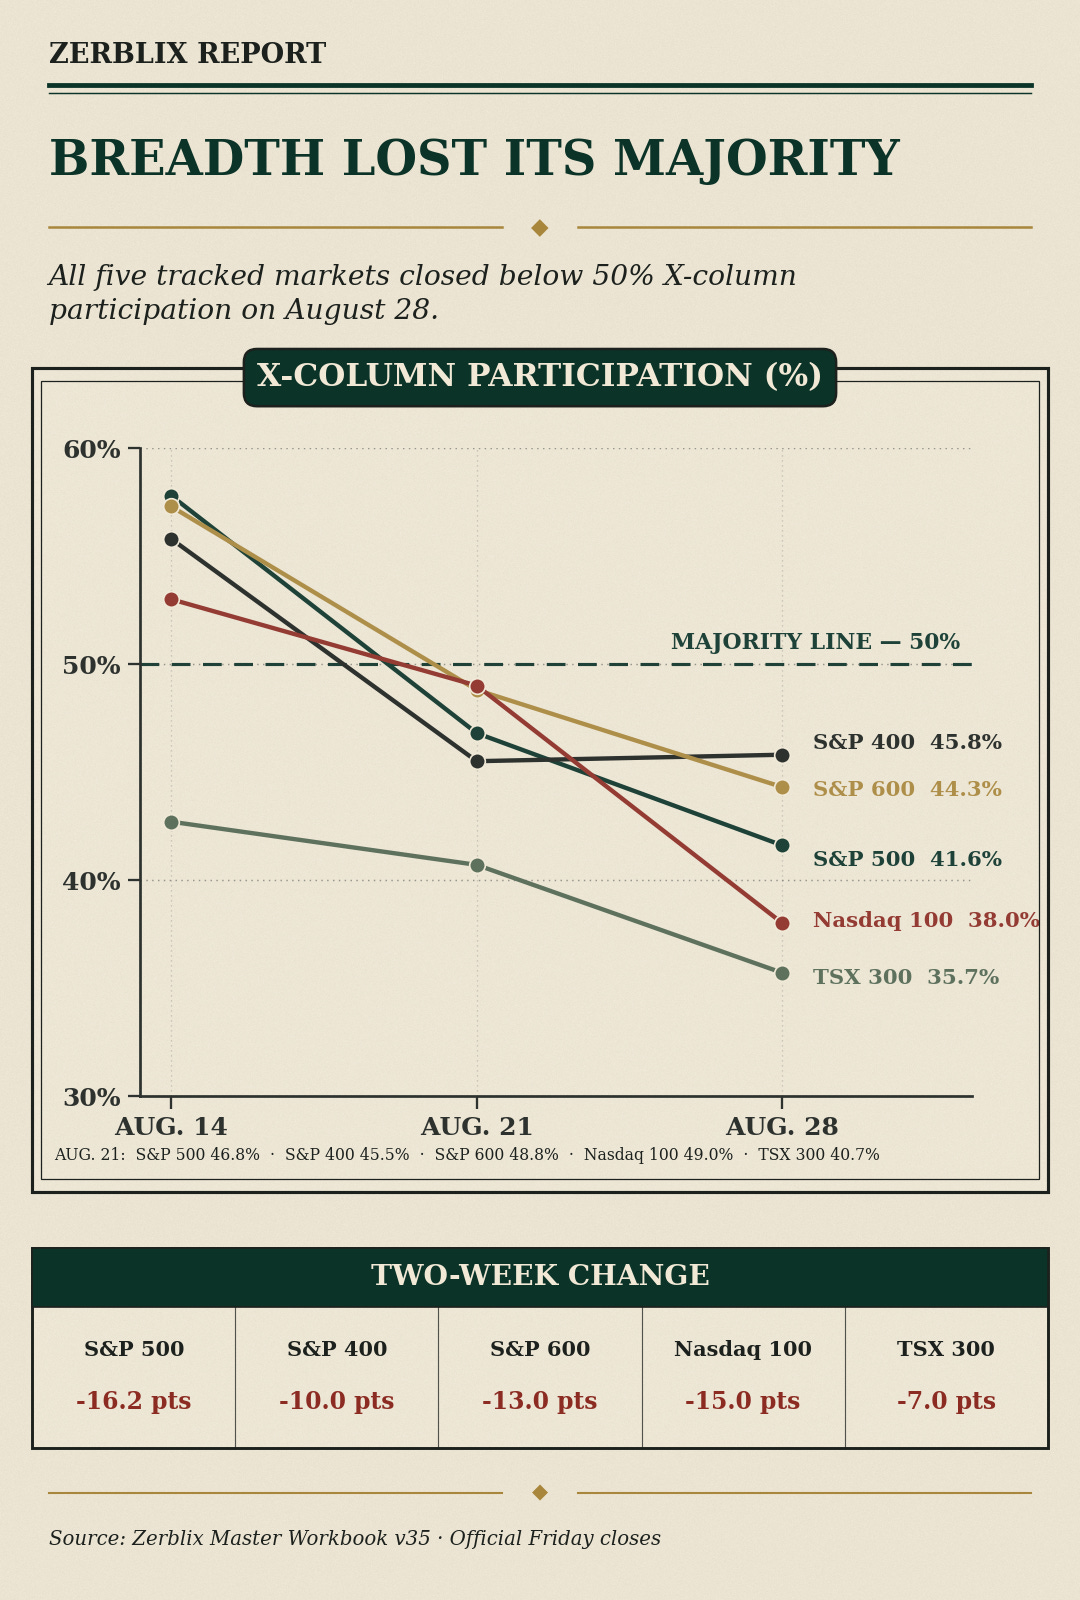
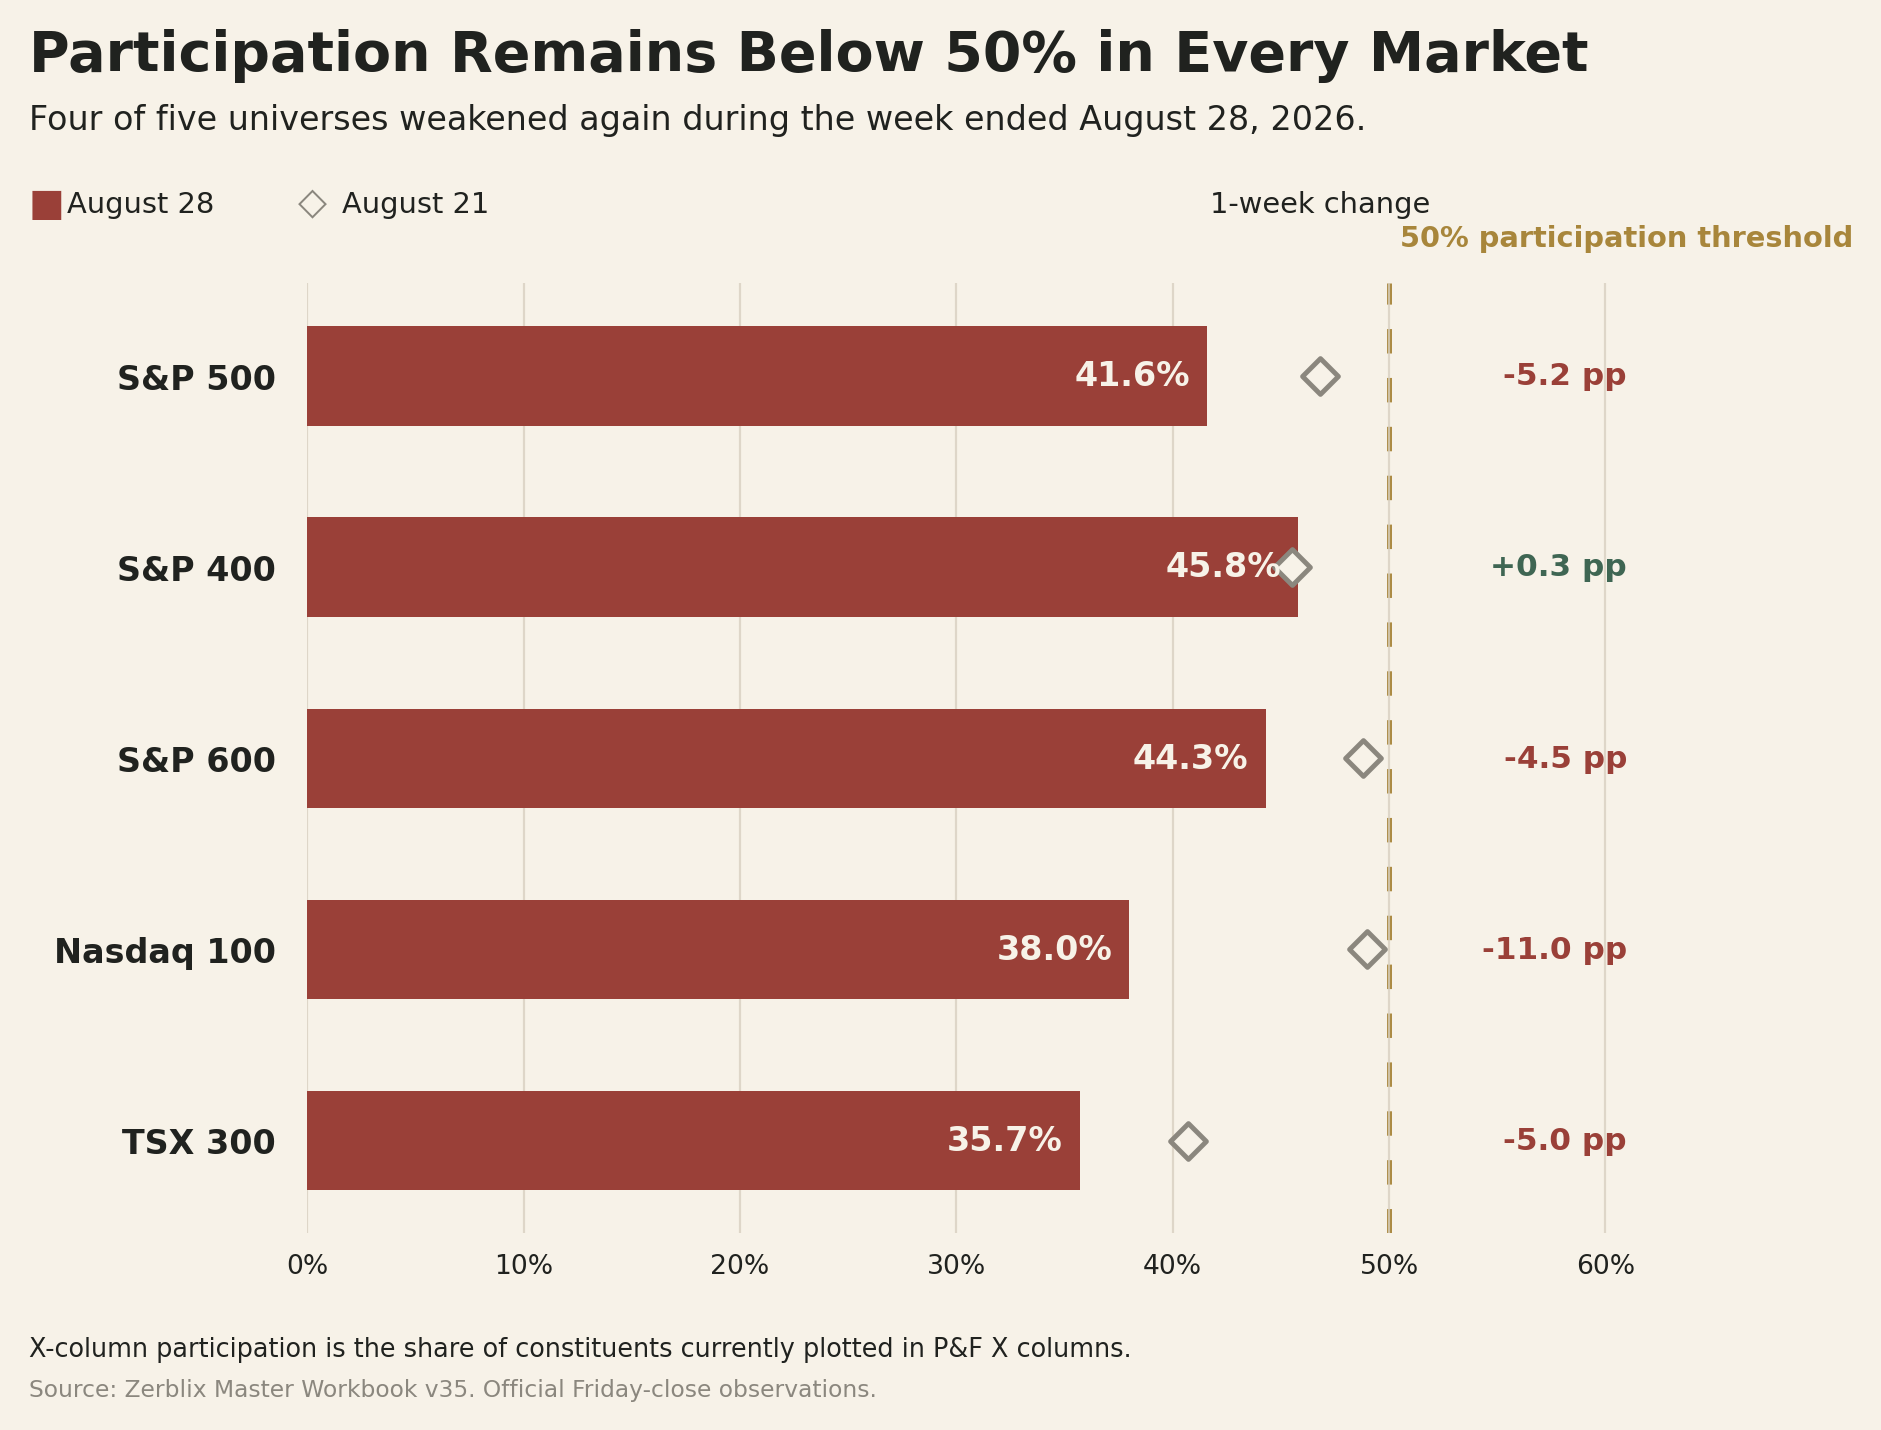
An X column records an advancing price movement under P&F construction; an O column records a decline. Participation below 50% therefore means declining columns outnumber advancing columns. Structurally, the majority has shifted from columns of demand to columns of supply. This does not, by itself, establish a bear market because many securities may remain on earlier buy signals even after reversing into Os. It does establish that demand no longer controls a majority of the underlying securities.
Four markets weakened again during the latest week. Mid-cap participation improved by only 0.3 percentage point and remained below the dividing line. The Nasdaq 100 recorded the sharpest weekly deterioration, falling 11 points to 38.0%. A recovery above 50% across several universes would show demand regaining the majority; continued readings below that level, particularly with lower weekly lows, would confirm that supply remains broadly in control.
Fresh Supply Expanded
The fresh-signal record reinforced the warning. Across the combined S&P 500, S&P 400, S&P 600 and Nasdaq 100 universe, 72 stocks produced fresh double-bottom breakdowns while only 16 produced fresh double-top breakouts. Technology accounted for 28 bearish signals and industrials for 18; semiconductors alone supplied 21 of technology’s breakdowns. The imbalance shows that new downside penetrations were developing at more than four times the rate of new upside penetrations.
These are newly emerging events, not cumulative lists of securities that have been weak for weeks. A double-bottom breakdown forms when an O column falls beneath the preceding O-column low. The earlier low marks a level at which demand had previously absorbed the available supply. Penetration of that level indicates that sellers have returned with sufficient force to overcome that support and record a new P&F sell signal. Follow-through into lower boxes would strengthen the bearish implication. A rapid reversal into Xs, followed by recovery through the preceding rally column, would weaken it and raise the possibility of a failed breakdown.
Existing structure was less uniformly bearish. The S&P 500’s core bullish and bearish pattern counts were nearly balanced at 167 versus 164, while the TSX retained the strongest bullish prevalence at 109 versus 58. Broad Bullish Percentage readings also remained above 50%: S&P 500 61.40%, Nasdaq 100 59.41%, NYSE 55.24% and TSX 64.06%.
The distinction matters. Many established buy signals have survived, but fewer securities are presently advancing. In P&F terms, the market has moved from broad forward progress toward a corrective condition inside an older bullish structure. Supply has expanded without yet destroying that structure. Further deterioration in the Bullish Percentages would provide the next important confirmation that the correction is reaching established buy signals rather than merely reversing active columns.
Leadership Has Narrowed, Not Disappeared
Seven of the eleven sector ETFs outperformed SPY over 13 weeks, compared with five over four weeks and only three over 26 weeks. This progression describes leadership that is visible over the intermediate horizon but has not yet become a durable long-term condition. Sector Bullish Percentage remained strongest in energy at 80.95%, health care at 77.97%, financials at 73.68% and consumer staples at 72.22%. Utilities stood at 38.71%, communication services at 45.00% and industrials at 48.10%.
The broad ETF screen retained 46 core leaders against only two core weaknesses. International and value-oriented funds, software and cloud, silver miners, agriculture and high-yield credit supplied the principal leadership clusters. FUTY and WGMI were the two weakness funds. Demand therefore remains concentrated in identifiable groups rather than absent from the market. The weakness is not the lack of leadership; it is the failure of that leadership to draw broad participation behind it.
These are prevalence screens, not automatic recommendations. Leadership is most dependable when the price chart, relative-strength chart, group condition and broad market agree. A publication setup therefore requires manual review at the locked Zerblix settings, evidence of follow-through and a visible level at which the interpretation would weaken or fail.
Confirmed Setups Under Review
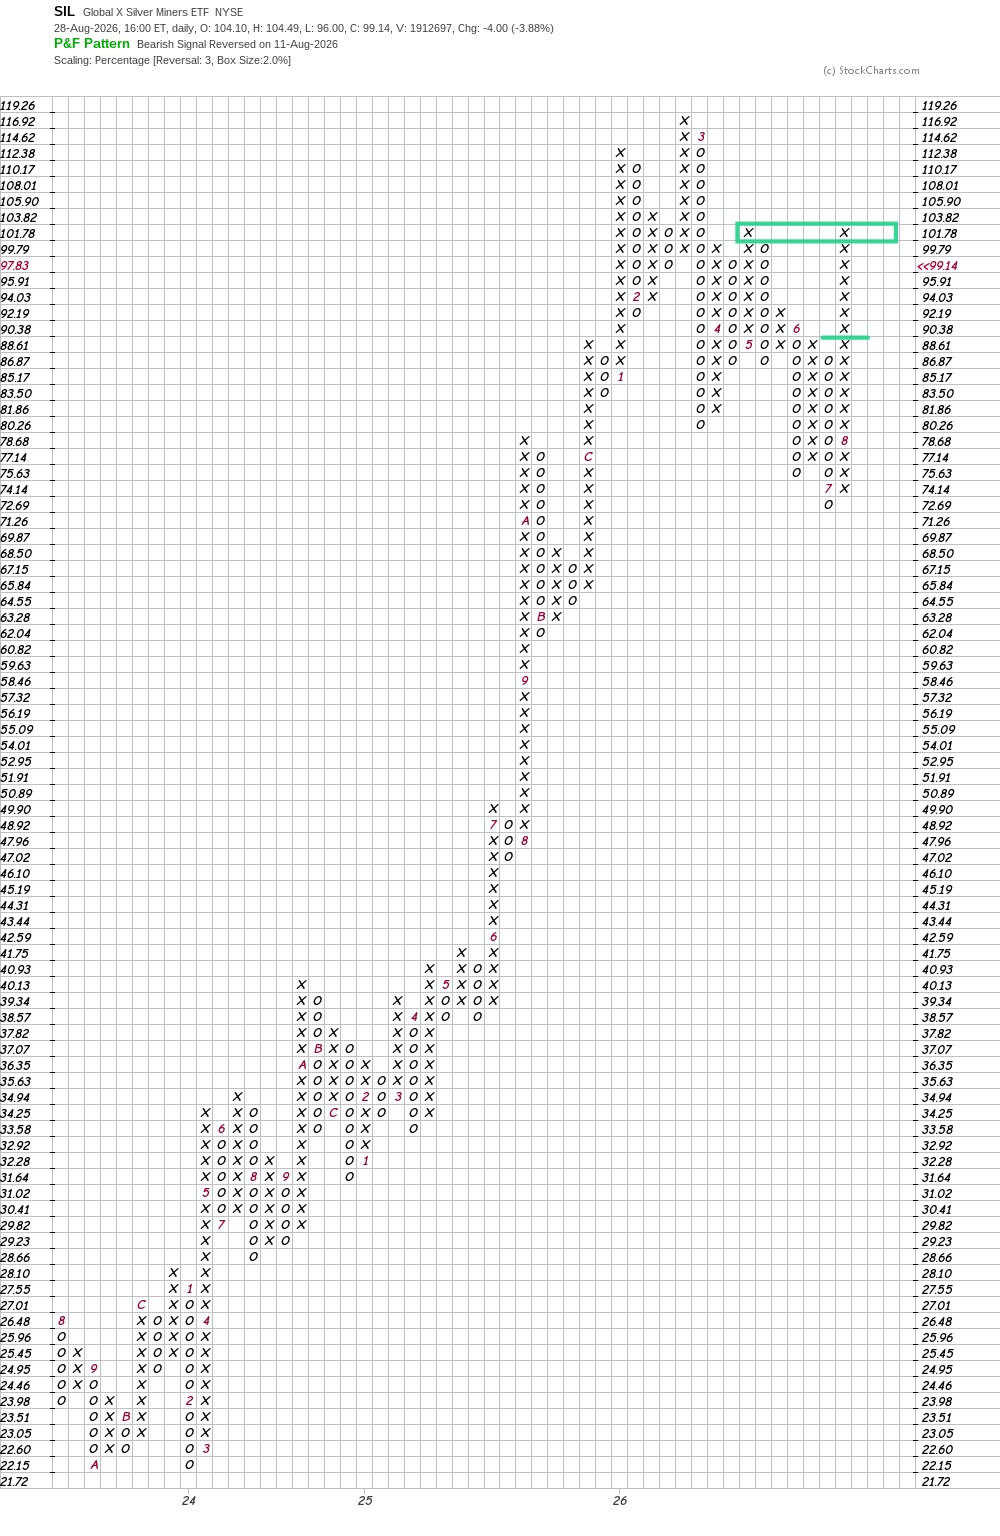
SIL: intermediate leadership meets near-term supply
Silver gained 14.63% over four weeks but declined 4.30% during the latest week. Despite that pullback, SIL, SILJ, SLVP and SLVR remained clustered in the ETF leadership screen, while Gold Miners Bullish Percentage improved 3.63 points to 68.49%.
Demand continued to control the column and carried the P&F plot to 101.78, matching the earlier May P&F high. Outside the close-only P&F chart, SIL traded as high as $104.49 on August 28, marginally exceeding May’s $104.10 intraday high. However, the fund closed at $99.14, so the intraday move did not print the 103.82 box or confirm a P&F breakout. A later close sufficient to print 103.82 would clear the matched P&F highs and establish a Double Top Breakout.
IGV: software retains selective demand
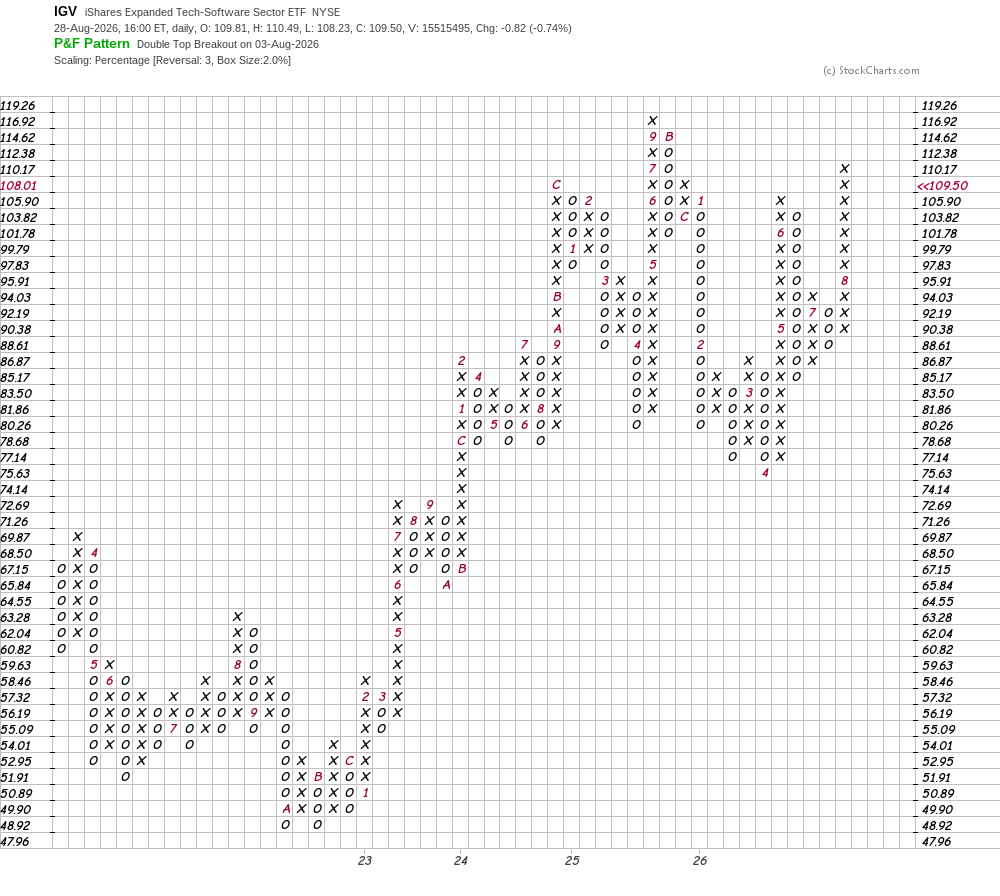
IGV appeared with CLOU, FDN and WCLD in the ETF leadership screen. At the stock level, ACN, APP, FIVN, MSFT and WDAY generated fresh bullish breakouts. This does not establish healthy technology breadth. It identifies a recognizable pocket of demand inside a sector experiencing substantial internal deterioration.
IGV remained in an X column and retained its August 3 Double Top Breakout. The original breakout occurred at 95.91, where demand overcame the preceding X-column high of 94.03—a level at which supply had previously stopped the advance. The subsequent rise to 110.17 demonstrated meaningful follow-through. A print at 112.38 would extend the current X column and provide further evidence that buyers remain willing to absorb supply at higher levels. A decline to approximately 103.82 would produce a normal three-box reversal into Os. Such a reversal would mark the return of supply but would not, by itself, invalidate the breakout. A later print at 86.87—below the preceding O-column low of 88.61—would generate a Double Bottom Breakdown and materially weaken the immediate bullish structure.
WGMI: crypto-miner weakness is chart-confirmed
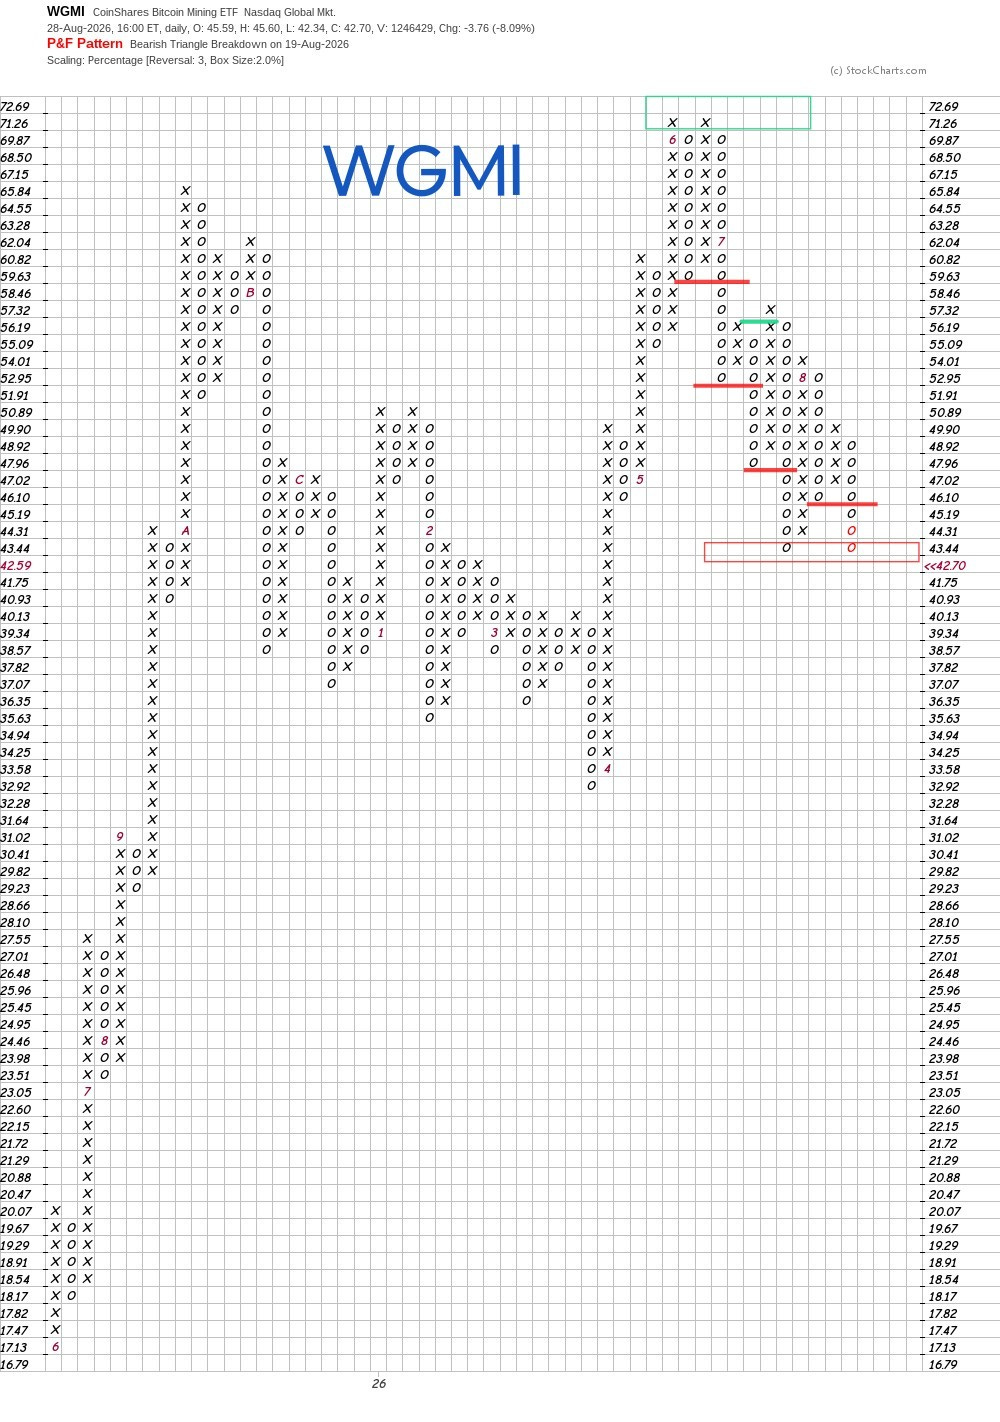
Digital assets demonstrated why daily detection and Friday confirmation must remain separate. Fourteen digital-asset products appeared in Thursday’s leadership screen, including IBIT. None remained Friday, while WGMI entered core weakness. BlackRock reported that IBIT’s August 28 NAV declined 3.13%.
WGMI turned lower after reaching an intraday all-time high of $76.94 in June. Because the Zerblix P&F chart uses closing prices and 2% box scaling, that intraday extreme was not plotted directly; the highest completed P&F box was 71.26. Since then, supply has produced a succession of lower rally peaks and downside penetrations at progressively lower support levels.
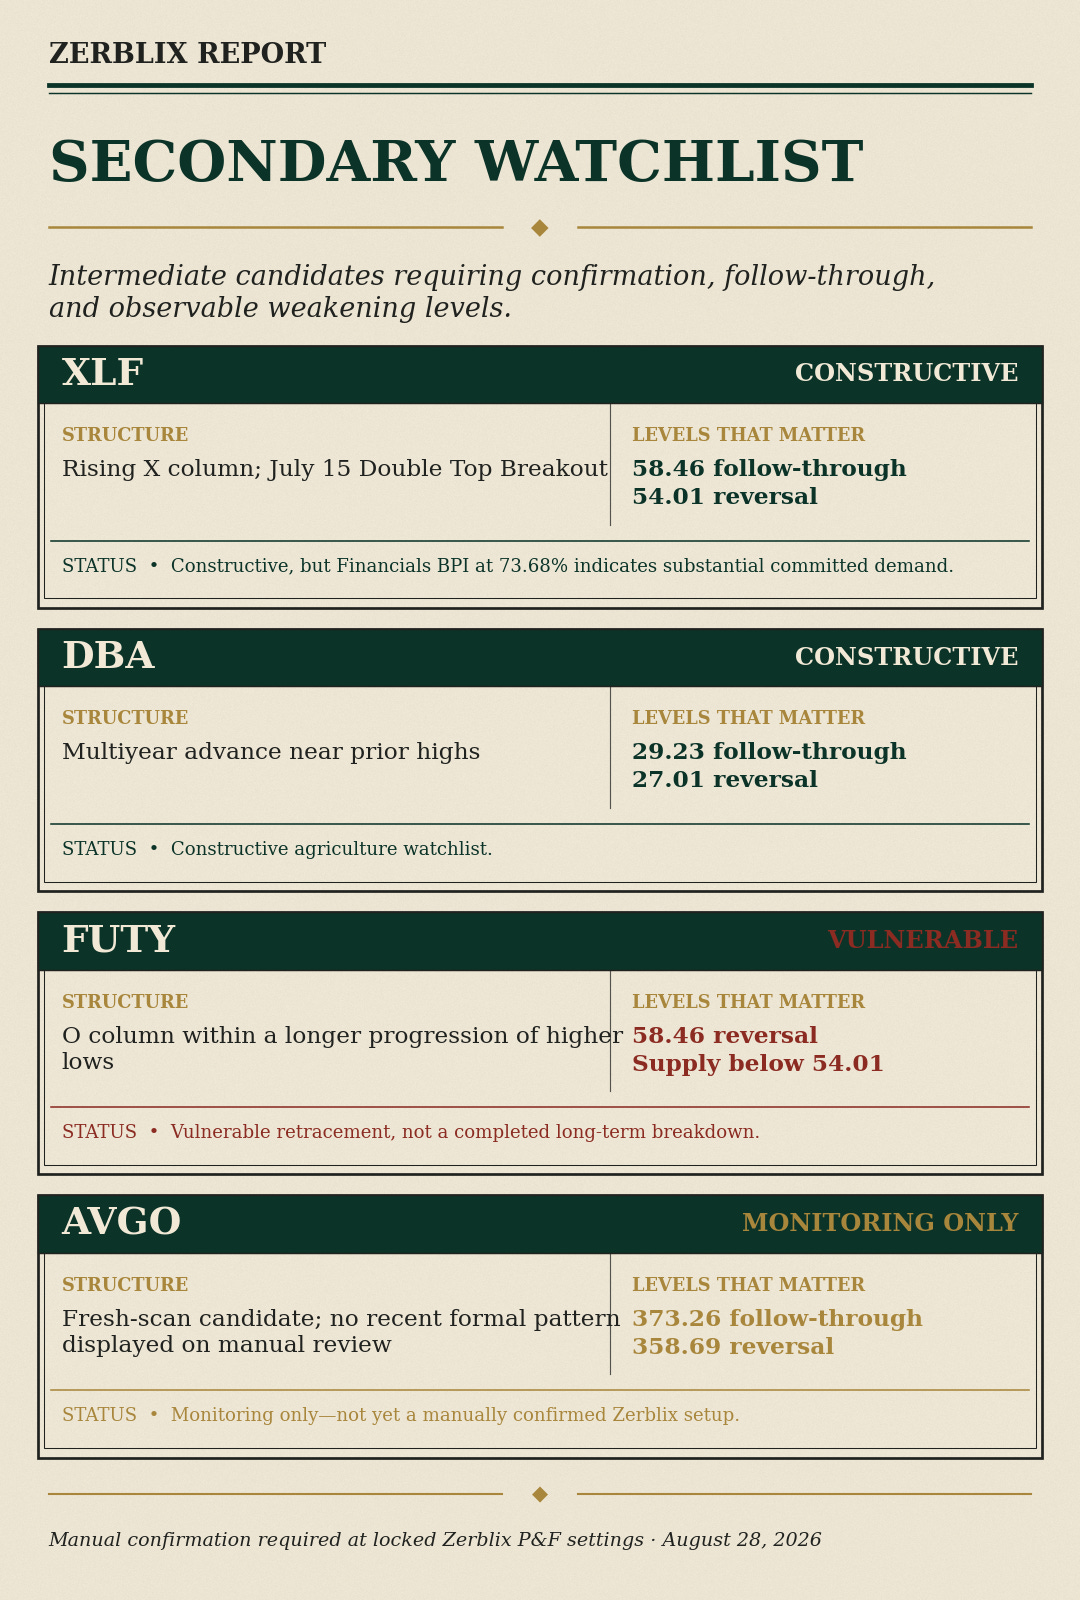
Secondary Watchlist
Cross-Asset and Historical Context
The remaining asset classes did not confirm an indiscriminate flight from risk. EWT advanced 11.76% over four weeks and 3.45% during the latest week, but did not satisfy the stricter combined price-high and P&F condition. HYG remained constructive relative to IEF, TLT improved 1.01% for the week and financial stress remained low. UUP’s 1.00% weekly gain left it almost unchanged over four weeks, suggesting a rebound rather than an established intermediate currency trend. Real estate remained comparatively weak, with VNQ down 1.73% over four weeks.
August strength in SLV, GLD and EWT was also unusually large relative to their completed 5-, 10-, 15-year and full-history August averages. Seasonality supplies context, not confirmation; current supply and demand must take precedence.
What Would Confirm or Weaken the Warning?
The breadth warning would strengthen if participation remains below 50%, bearish breakouts continue to exceed bullish events, broad BPI readings begin falling materially or weakness expands beyond FUTY and WGMI. That sequence would show the present column deterioration spreading into the market’s older signal structure.
The warning would weaken if several markets recover majority X-column participation, the fresh-signal imbalance narrows, small caps and equal-weight indexes improve, and the remaining leaders produce follow-through accompanied by broader sector participation. Such action would indicate that demand is no longer confined to isolated groups and is again gaining control of the broader list.
Bottom Line
The August 28 evidence does not support an indiscriminate bearish conclusion. Leadership remains visible, credit is orderly and financial stress is low. It also does not support treating index resilience as proof of a healthy broad advance.
For swing-to-intermediate traders and investors, the practical response is disciplined selection. Existing leaders can be respected while their structures remain intact, but new exposure should require confirmation and an observable weakening level. Continued breadth deterioration would indicate that the remaining leaders are becoming increasingly isolated.
Confirmation remains more valuable than attempting to identify the perfect turning point.
Methodology and Sources
All market readings use the official Friday, August 28, 2026 close unless another date is stated. Stocks use 1% boxes; ETFs and indexes use 2% boxes; relative-strength ratios use 1% boxes. All use three-box reversals and daily close-only data. Fresh signals were true on August 28 and false on the preceding scan; R01/R02 and Pattern Pressure are prevalence measures. Returns use verified adjusted closes in Zerblix Master Workbook v35. Incomplete August 2026 data are separated from completed historical samples. Financial-stress data are from the Federal Reserve Bank of St. Louis; IBIT fund data are from BlackRock.