


HUT’s longer-structure P&F chart is improving after a prolonged corrective phase, but the next bullish signal has not yet been completed.
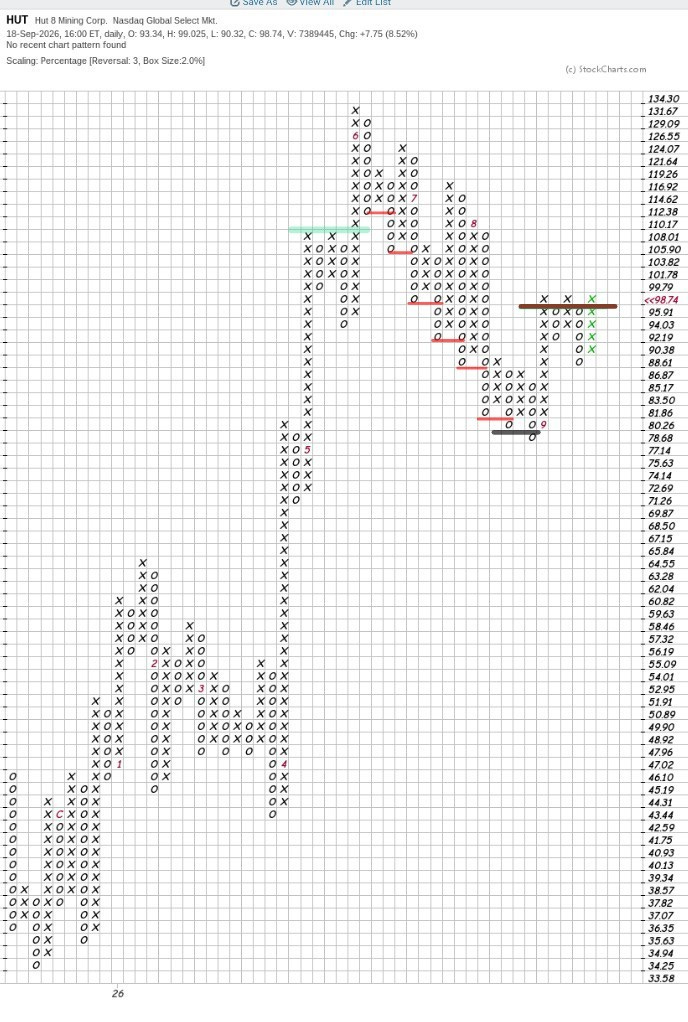
HUT’s 2% / three-box / daily-close Point & Figure chart shows an important change in structure.
The chart first recorded a powerful expansion in X-columns as demand took control. That advance eventually produced a triple-top breakout, and the breakout was followed by substantial upside progress.
The character of the chart later changed.
During the correction, HUT produced a series of bearish signals as supply repeatedly pushed price through prior support. The decline eventually reached the September low, where the final downside break failed to produce sustained follow-through.
Demand then returned.
HUT has since reversed higher and is again testing an important resistance area.
Reading the chart
1. Demand Expansion — blue
A strong wall of X-columns shows a period when demand clearly controlled the trend. Buyers were able to move price through successive boxes with relatively little interruption from supply.
2. Triple-Top Breakout — green
The earlier breakout above triple-top resistance was followed by a substantial advance. That follow-through is important. Demand did not simply move one box above resistance and stop; buyers continued to push price higher, confirming the breakout.
3. Repeated Bearish Signals — red
The later correction produced seven successive bearish signals.
Each downside break showed supply overcoming another support level and pushing the chart lower.
The important feature is the sequence rather than any single breakdown:
support repeatedly failed;
rallies stopped below earlier highs;
supply remained in control through much of the correction.
4. Bear Trap / Failed Breakdown — black
Near the September low, the final downside break failed to continue.
The brief push below support did not attract enough additional supply to extend the decline. Instead, demand returned and HUT reversed higher.
This is the important change in character.
The red “9” on the P&F chart is the September month marker. The bear-trap interpretation comes from the failed downside break and reversal, not from the number itself.
5. Developing Triple Top - brown
The current formation is now pressing the same resistance area near 97.83.
At the same time, the intervening lows have moved higher.
That produces a developing triple top with higher bottoms.
In supply-and-demand terms, sellers have continued to defend the resistance area, but they have become less successful at pushing HUT back to its previous lows.
That is constructive.
The important distinction is:
HUT has a developing triple-top setup. It has not yet completed the breakout.
What matters next
97.83 — Current resistance: price is testing the existing triple-top ceiling.
99.79 — Breakout confirmation: a print at this box would complete the current triple-top breakout on the 2% chart.
110-112 — Previous reaction high zone area: follow-through into this area would provide stronger evidence that the intermediate correction is being repaired.
Below 88.61 — Weakening: a decline through this area would begin to damage the recent higher-bottom structure.
81.86 -78.68— Major support or failure zone: a return through this region would materially weaken the larger repair.
The practical interpretation
HUT’s longer-term structure remains constructive, but the intermediate structure is still repairing the damage created during the summer decline.
The important development is not simply that the stock has rallied.
It is that repeated bearish signals eventually stopped producing additional downside progress, support began to rise, and demand is now pressing the same resistance area again.
The next test is clear:
HUT’s longer-term structure remains constructive, but the intermediate structure is still repairing the damage created during the summer decline.
The important development is not simply that the stock has rallied. Repeated bearish signals stopped producing additional downside progress, support began to rise, and demand is again pressing the same resistance area.
The immediate test is 99.79, where a new X would complete the developing triple-top breakout. Beyond that, the larger structural test sits near 110–112, where earlier rallies encountered supply.
As long as the recent higher-bottom structure holds above 88.61, the repair remains intact. A return into the 81.86–78.68 September base would materially weaken that interpretation.
Disclaimer: Zerblix Report provides general market research and educational commentary only. Nothing published here is individualized investment advice, a recommendation to buy or sell any security, or a guarantee of future results. Markets involve risk, and readers should conduct their own research and consider their own financial circumstances before making investment decisions.