


The Zerblix read: On September 21, fresh U.S. Double Top candidates led Double Bottom candidates. By the September 28 close, Double Bottom candidates led by a wide margin. This marks a change in new pattern activity, though it does not by itself confirm a change in the intermediate trend.
The structure
The fresh Double Top scan looks for potential breakouts above a prior point-and-figure high, where demand may be overcoming resistance. The fresh Double Bottom scan looks for potential breakdowns below a prior low, where supply may be overcoming support. A scan match remains a candidate until its individual chart is reviewed.
Monday, September 21: 49 bullish breakout matches and 33 bearish breakdown matches, a net +16.
Monday, September 28: 16 bullish breakout matches and 83 bearish breakdown matches, a net −67.
These are separate daily scans of new candidates. The counts are neither a cumulative weekly total nor a tally of all established P&F patterns.
Where supply appeared
The shift was most visible in groups that supplied much of last Monday’s bullish flow:
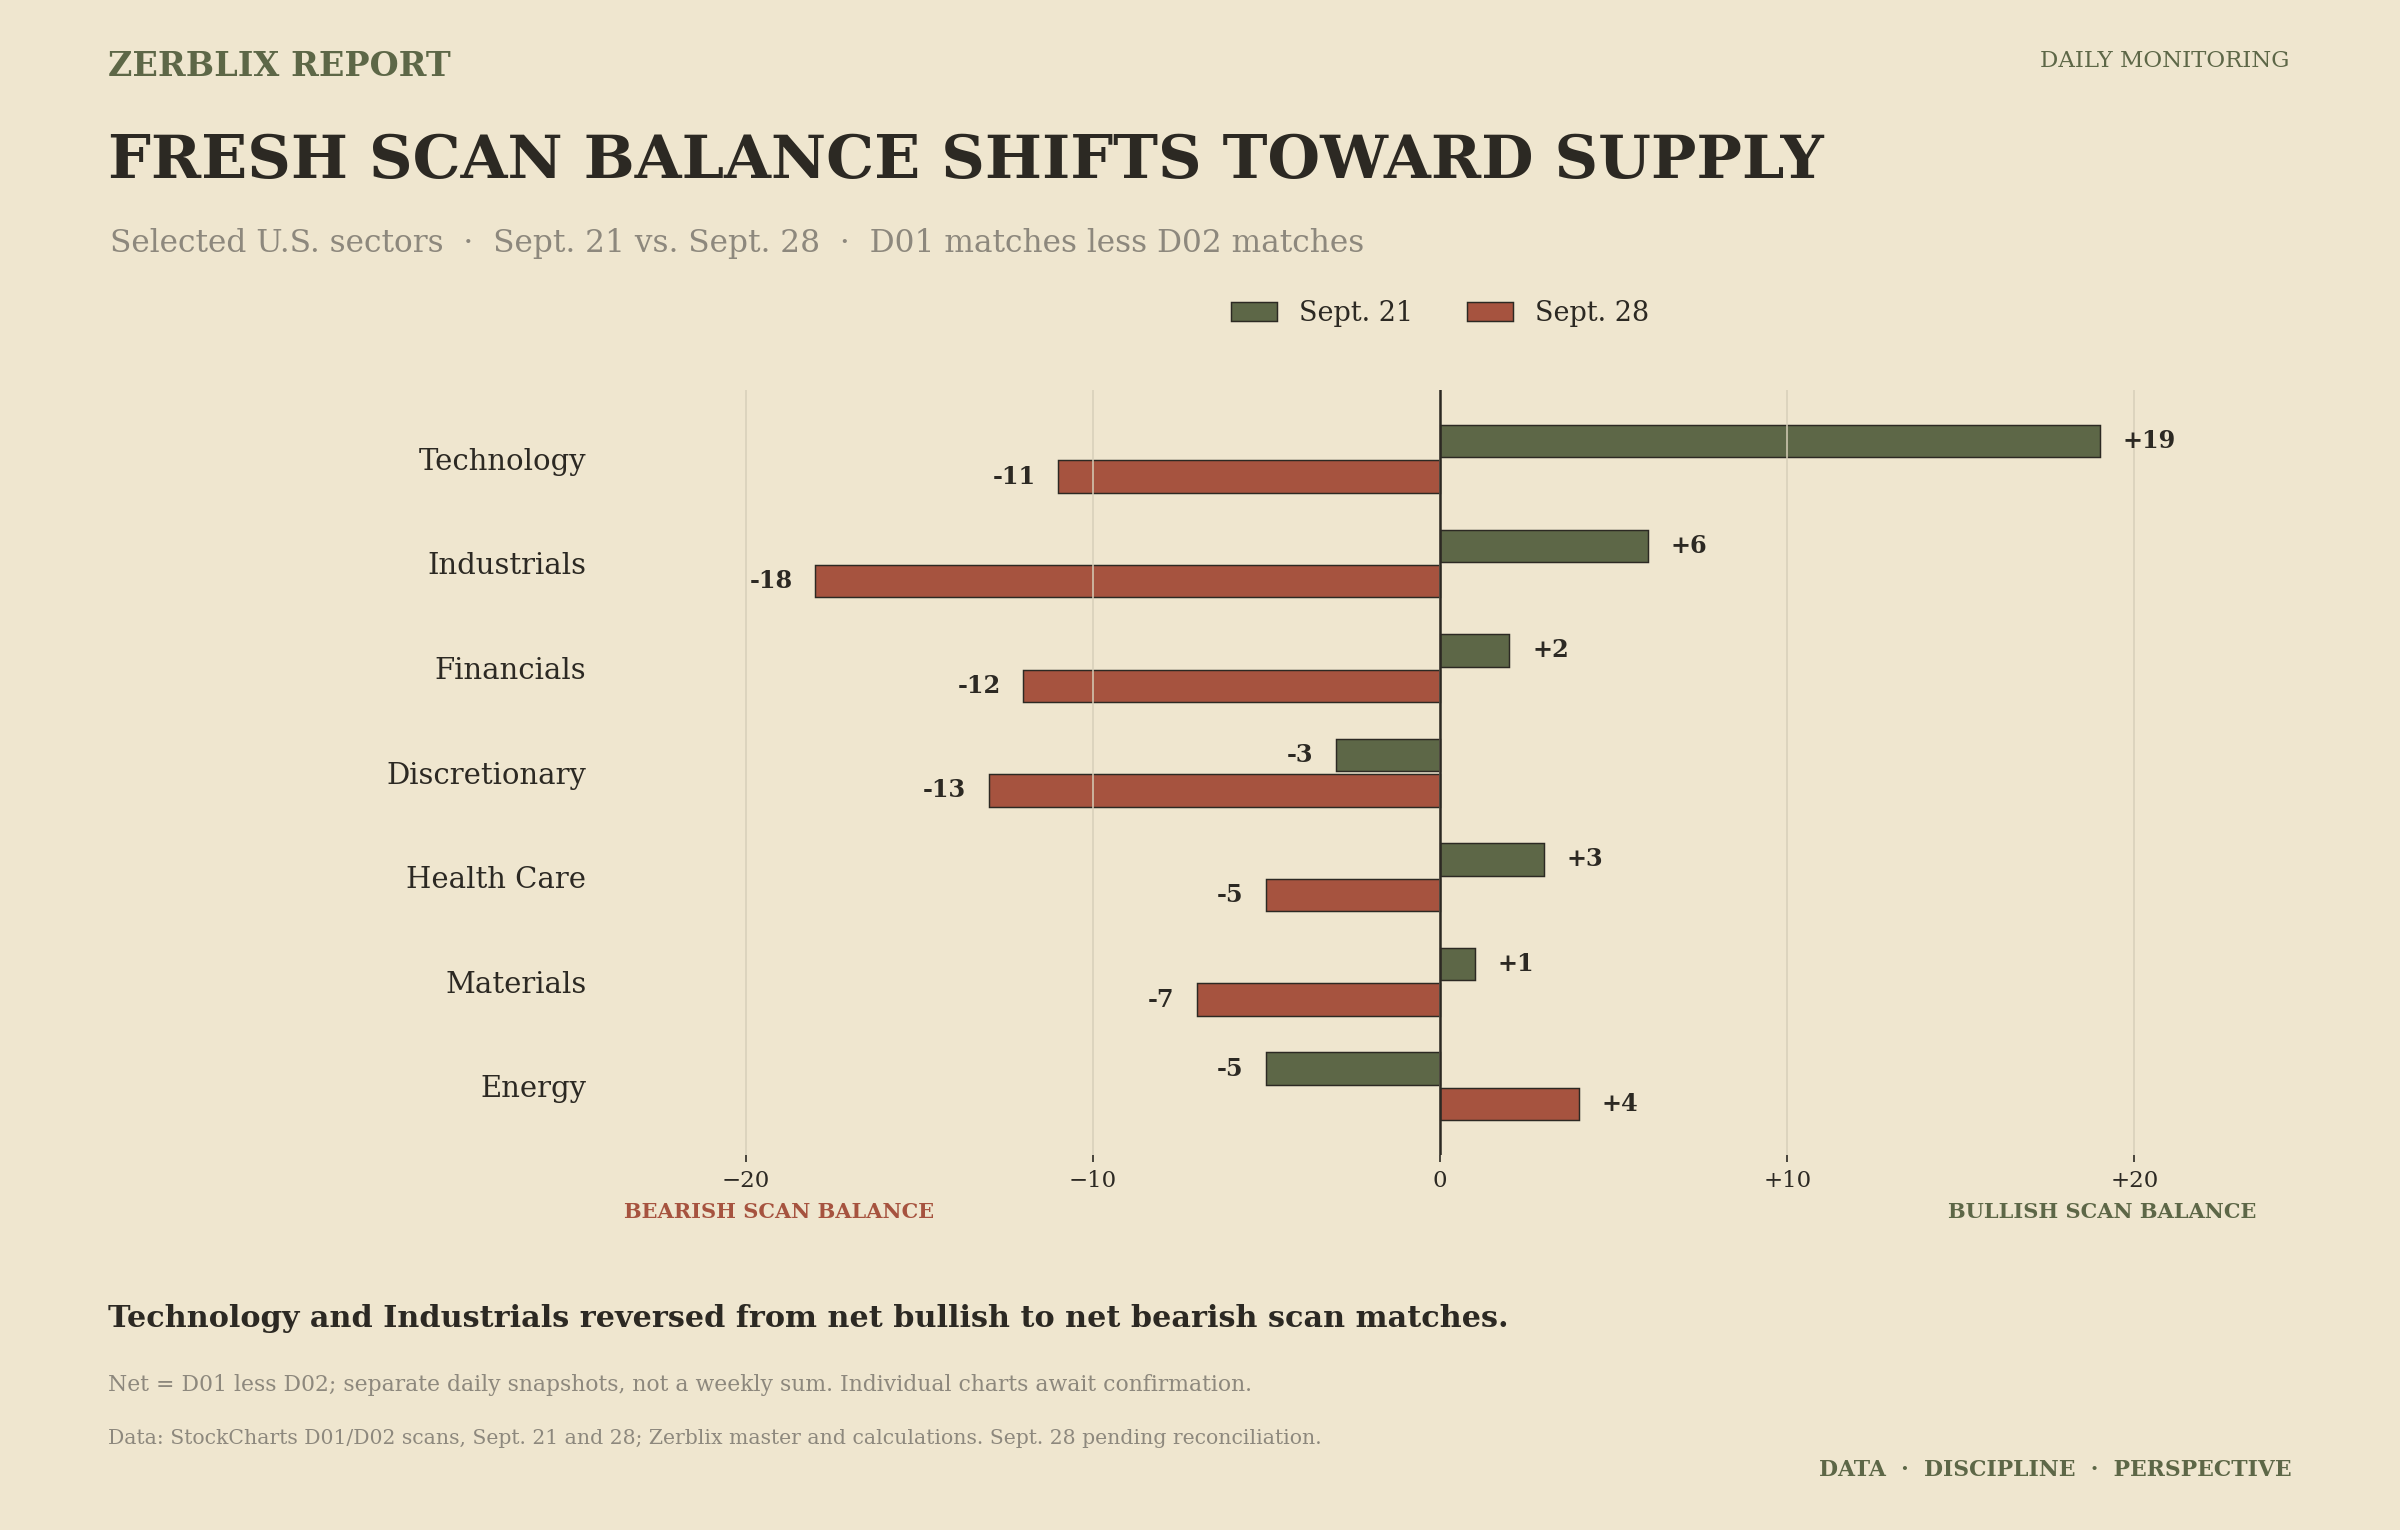
Technology: 21 bullish and 2 bearish matches on September 21 became 4 bullish and 15 bearish on September 28. Its daily net moved from +19 to −11.
Industrials: 14 bullish and 8 bearish became 2 bullish and 20 bearish, moving the daily net from +6 to −18.
Financials: 3 bullish and 1 bearish became 0 bullish and 12 bearish, shifting from +2 to −12.
Energy: moved the other way, from 1 bullish and 6 bearish to 6 bullish and 2 bearish. Its +4 net on September 28 is a countercurrent to the broader scan imbalance.
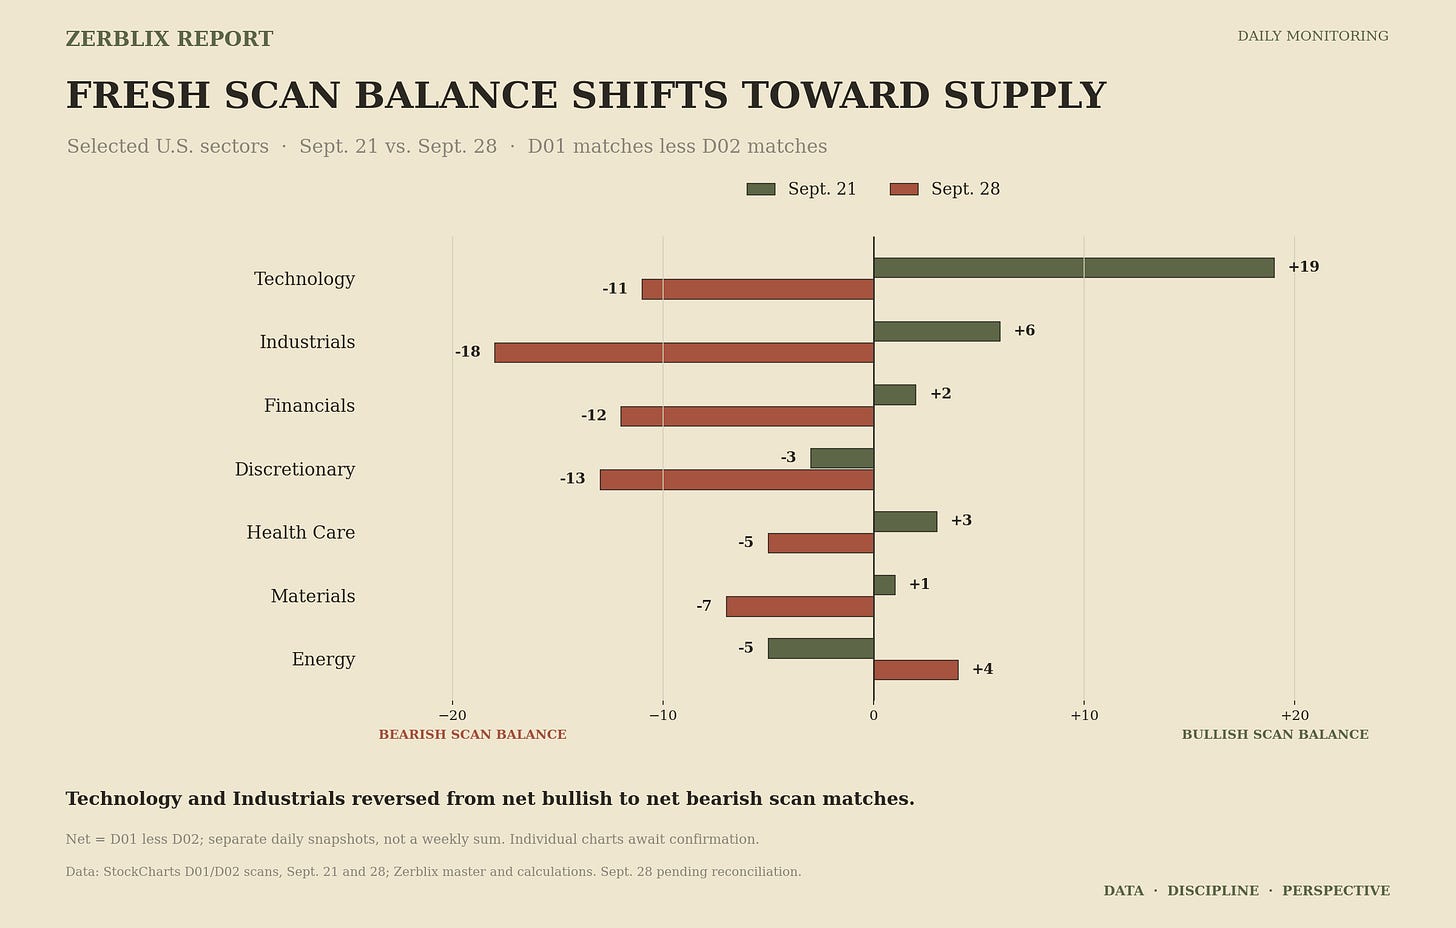
Figure 1. Fresh P&F scan balance by sector, September 21 and 28. Net equals bullish D01 matches minus bearish D02 matches. These are separate daily snapshots, not a weekly total. Data: StockCharts; calculations: Zerblix Report. Fresh bearish candidates now outnumber fresh bullish candidates across several groups. Energy’s exception matters: the evidence describes uneven participation, not a uniform market move.
A related breadth check
The Nasdaq 100 Bullish Percent Index stood at 44.55 at the September 25 Official Friday close and 37.62 at the September 28 close, a decline of 6.93 percentage points versus Friday. Bullish Percent Index (BPI) tracks the percentage of components on P&F buy signals. It does not measure today’s count of fresh scan matches, so the two readings should be read together without combining them.
Fresh bearish candidates now outnumber fresh bullish candidates across several groups. Energy’s exception matters: the evidence describes uneven participation, not a uniform market move.
What would confirm or weaken the read
Friday’s evidence remains the official weekly benchmark. Continued bearish candidate flow, chart confirmation, and weaker buy-signal participation on the next Official Friday would strengthen the case that supply is spreading. A return of bullish candidates alongside stabilizing Bullish Percent Index (BPI) would weaken Monday’s warning.
For now, the practical reading is an early change in fresh P&F scan pressure. It calls for follow-through checks before changing the intermediate-horizon classification.