


Friday brought a strong balance of new bullish Point & Figure signals and a substantial recovery in mid- and small-cap X-column participation from the prior Friday. The existing buy-signal base did not provide the same confirmation. This was a broadening attempt whose follow-through remains to be tested.
This week at a glance
Mid- and small-cap participation was higher at the second Friday close. The S&P 400 rose from 34.5% to 45.5% in X columns; the S&P 600 rose from 35.7% to 43.5%.
Friday’s new US signals favored demand: 86 fresh double-top breakouts versus 15 double-bottom breakdowns.
The S&P 500 remained the main qualification: its Bullish Percent Index fell 5.20 points from the prior Friday to 31.80, and its Pattern Pressure remained deeply negative.
Participation at two Friday closes
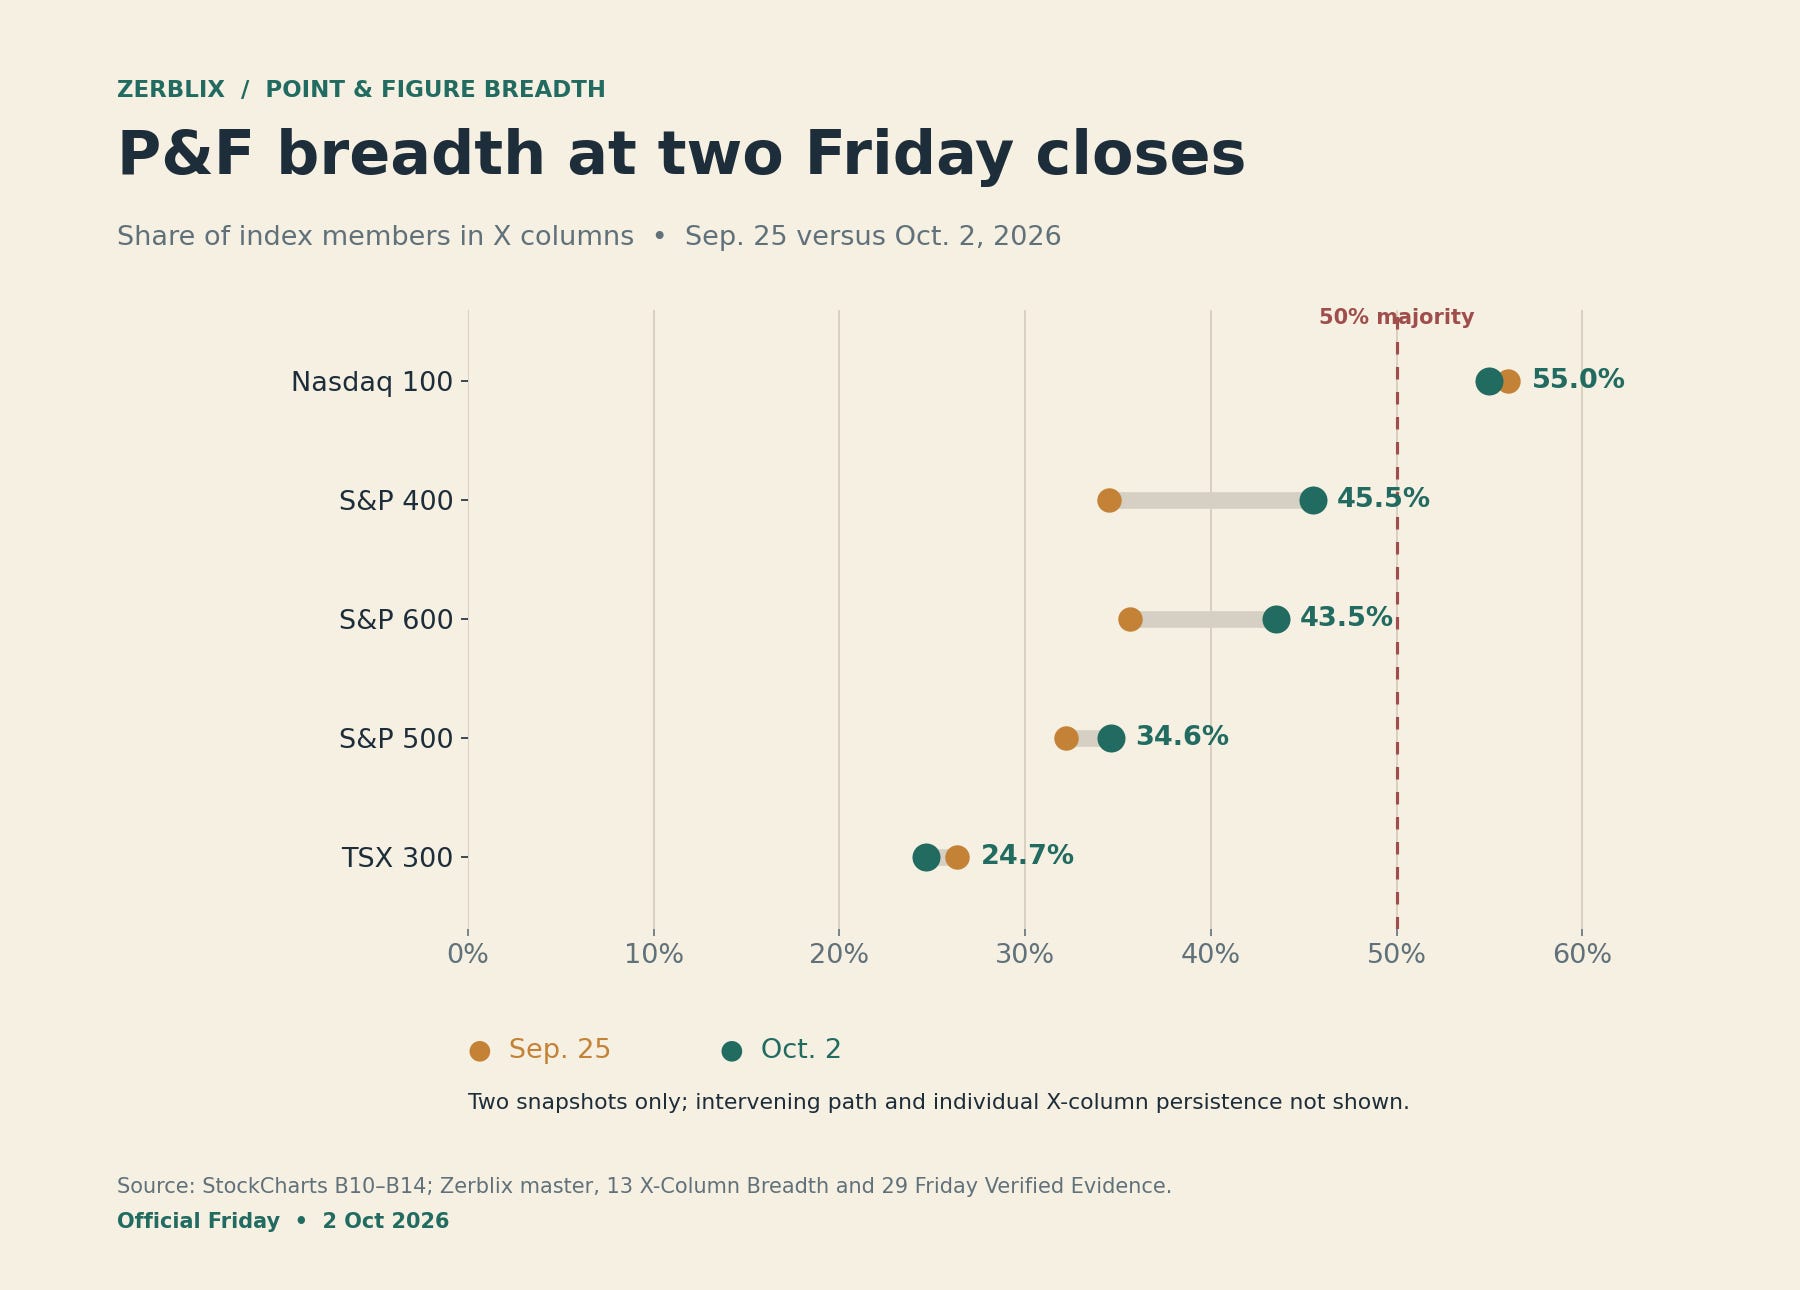
S&P 500: X-column participation rose from 32.2% to 34.6%; Pattern Pressure weakened from −50.60 to −52.40.
S&P 400: Participation rose from 34.5% to 45.5%; Pattern Pressure improved from −41.94 to −27.15.
S&P 600: Participation rose from 35.7% to 43.5%; Pattern Pressure improved from −40.89 to −23.32.
Nasdaq 100: Participation slipped from 56.0% to 55.0%; Pattern Pressure rose from −1.45 to 0.00.
S&P/TSX 300: Participation fell from 26.3% to 24.7%; Pattern Pressure weakened from −15.15 to −29.63.
(Figures compare two official Friday closing snapshots: September 25 and October 2. They do not show the intervening daily path.)
X-column participation measures current P&F column direction. Pattern Pressure balances selected bullish and bearish pattern-family counts. Families can overlap, so Pattern Pressure is not a percentage of distinct stocks. Changes were calculated from exact workbook values before display rounding.
The S&P 400 gained 11.0 percentage points in X-column participation between the two closes; the S&P 600 gained 7.8 points. Their Pattern Pressure improved by 14.78 and 17.57 points, respectively. More constituents were in advancing columns on October 2, and the established pattern balance was less bearish. Both groups nevertheless remained below 50% participation, and both pressure readings remained negative.
The S&P 500 improved only 2.4 points in X-column participation to 34.6%, while its Pattern Pressure deteriorated 1.80 points to −52.40. The Nasdaq 100 was the only one of these five groups above 50% in X columns, at 55.0%, one point below the prior Friday. TSX 300 participation fell to 24.7%, and its Pattern Pressure declined to −29.63. The US mid- and small-cap improvement was neither universal nor yet a majority condition.
New signals versus the existing base
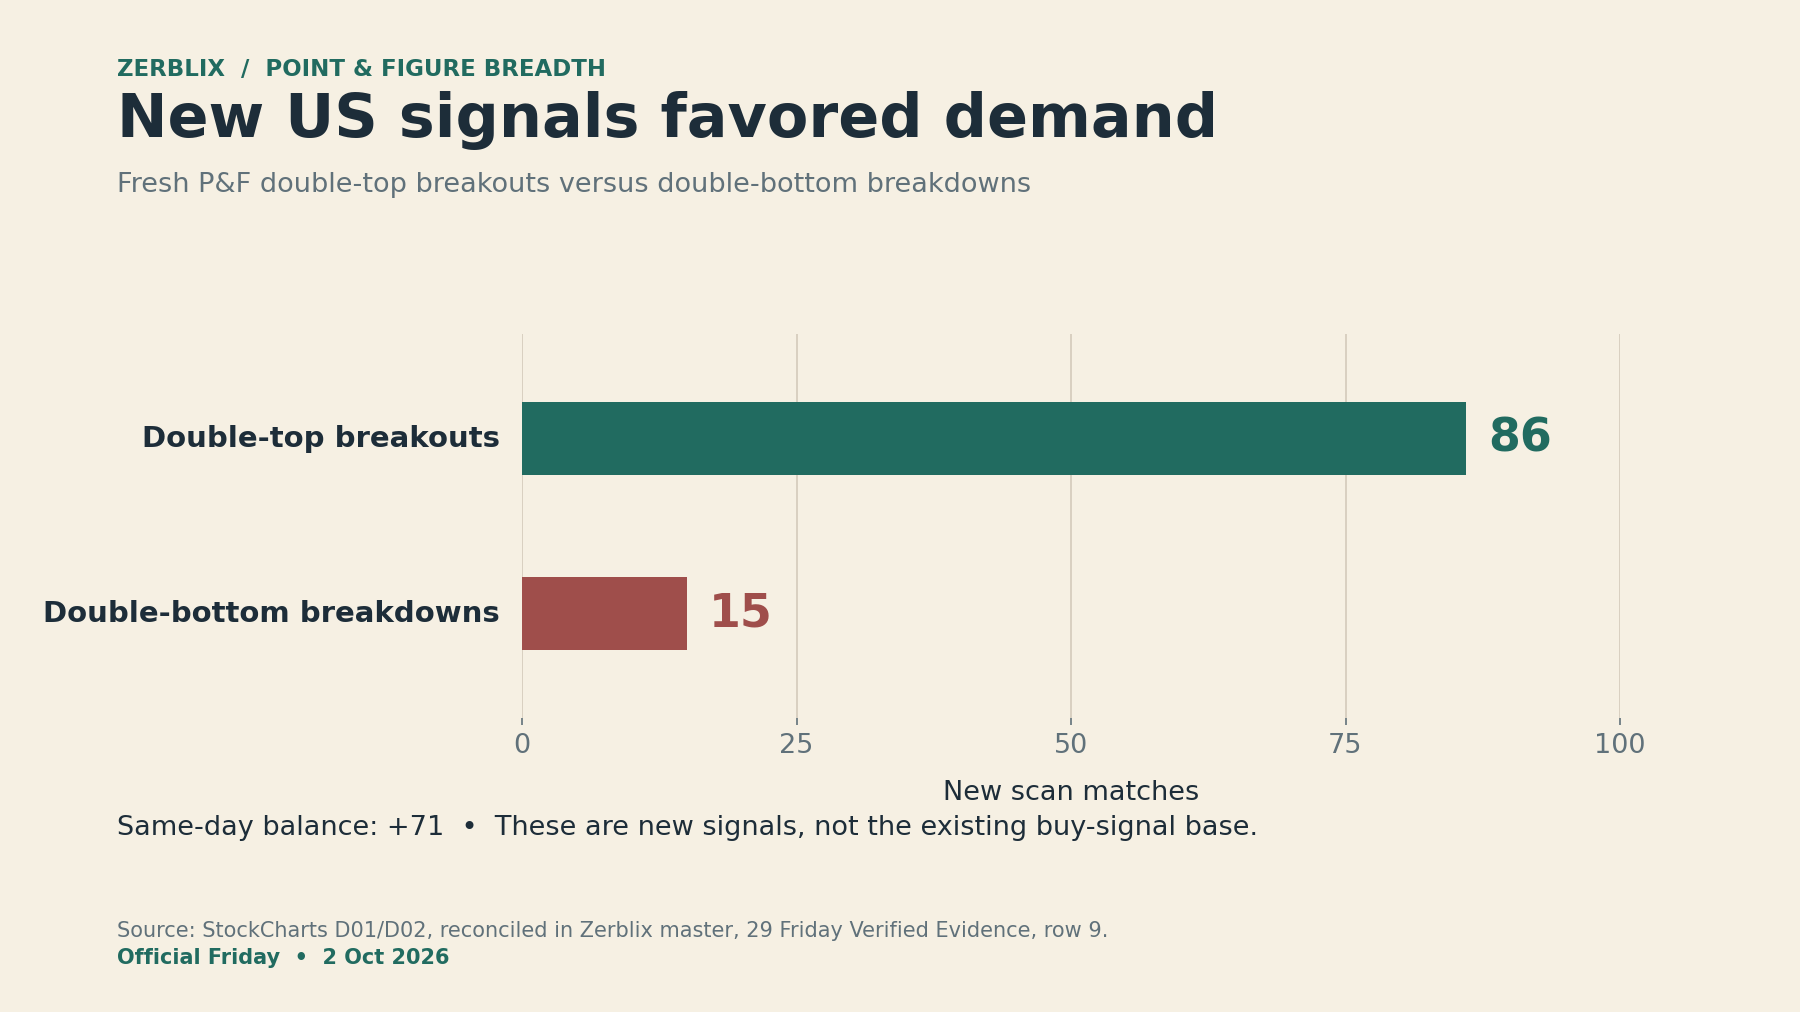
The fresh US scans favored the upside 86 to 15 on Friday. Canada’s corresponding scans returned six versus two. A double-top breakout occurs when a rising X column exceeds its prior X-column high; a double-bottom breakdown occurs when a falling O column drops below its prior O-column low. These are new signals at specific price levels. They do not by themselves establish a weeklong trend.
The Bullish Percent Index asks a different question: what share of a group remains on active P&F buy signals? S&P 500 BPI closed at 31.80, up 0.40 point during Friday’s session but down 5.20 points from September 25. Nasdaq 100 BPI was 41.58, up 1.98 Friday but down 2.97 for the week. TSX Composite BPI was 49.30, up 0.93 Friday but down 4.65 for the week. The TSX Composite BPI and TSX 300 X-column scan cover differently named universes and are kept separate.
The distinction: Friday supplied new bullish signal flow and stronger mid- and small-cap column direction. The established S&P 500 buy-signal base had not recovered its prior Friday position.
Where the new signals appeared
Technology accounted for 38 of the 86 fresh US double-top matches, including 12 semiconductor names. Industrials contributed 29. In the established-pattern inventory, Technology’s Pattern Pressure stood at +22.43, while Health Care was −50.81, Financials −23.34, and Materials −64.52. Those sector pressure readings measure an existing pattern balance, not Friday’s new-signal counts.
On the downside, seven of the 15 fresh US double-bottom matches were in Health Care. Technology was not uniform either: STX and WDC appeared on the downside in the scan’s computer-hardware classification. New demand was clustered, and pockets of supply persisted.
EWT in the ETF screen
EWT, the iShares MSCI Taiwan ETF, was the only distinct fund appearing in both the 252-day and 63-day leader screens on October 2. Both matches reflect the same ETF’s active P&F condition and new price high. Its chart warrants a closer look, but this screen alone does not establish broad international leadership.
What would strengthen or weaken the reading?
Further official Friday closes with S&P 400 and S&P 600 X-column participation above 50%, a less negative pattern balance, and a recovering S&P 500 BPI would strengthen the breadth case. A retreat in those participation gains, or continued deterioration in the S&P 500’s buy-signal base, would weaken it. The October 2 fresh breakouts also need time to show whether they hold.
Reading of the week: Demand returned to fresh US signal flow and to mid- and small-cap X columns between the two Friday snapshots. Established buy-signal breadth and the S&P 500’s bearish pattern balance still limit broad confirmation.
Source and method: supplied StockCharts.com scans and ChartLists at the October 2 close, reconciled with the Zerblix master workbook. Official Friday comparisons use September 25 and October 2. For information only; not investment advice.