


More large-cap charts have turned upward, but buy-signal participation has not recovered to its four-week baseline. Brazil stands out for price strength within the tracked macro basket. Energy leads the sectors in three-month relative strength, while Technology retains positive four-week and three-month relative performance despite its weekly setback.
This review uses Official Friday observations through October 9, 2026. Comparisons cover October 2–9 for one week, September 11–October 9 for four weeks, and July 10–October 9 for three months. References to one month follow the standing four-week convention. Exchange-traded funds (ETFs) represent the tracked exposures; commodity funds serve as investment proxies rather than direct measurements of commodity prices.
The verified price backdrop
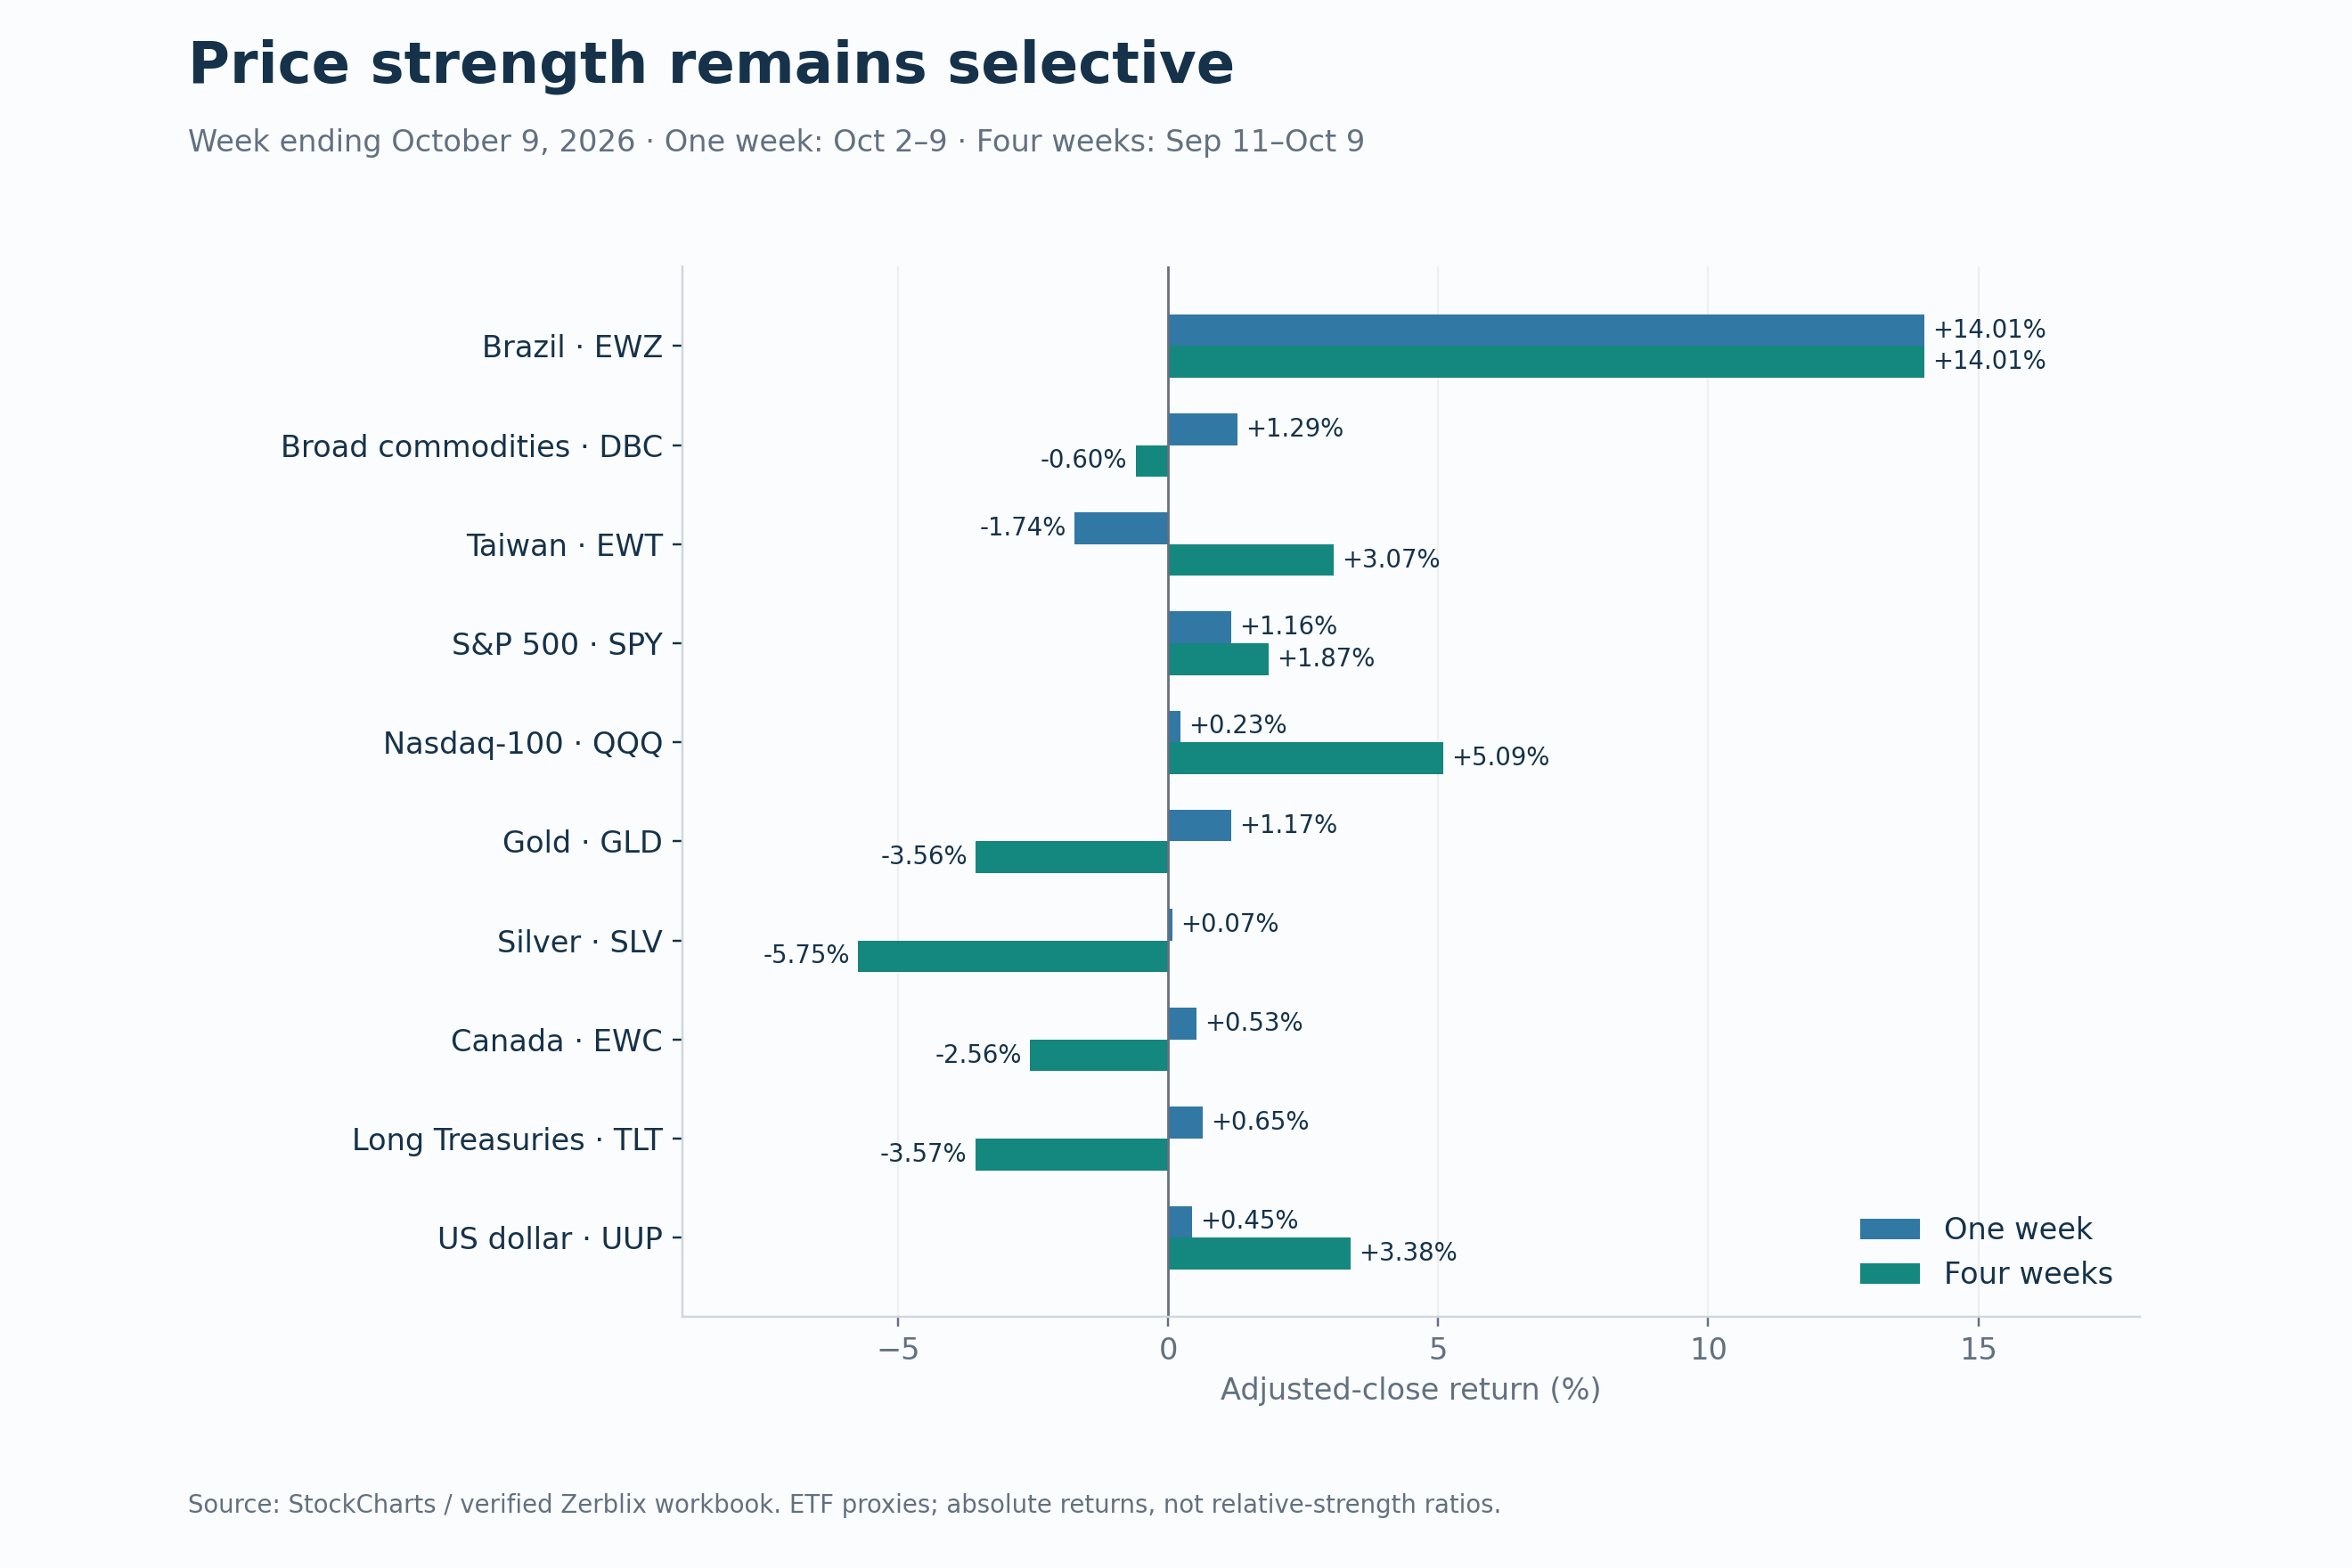
Returns are shown over one week, four weeks and three months.
Brazil — EWZ: One week +14.01%; four weeks +14.01%; three months +21.18%.
Broad commodities — DBC: One week +1.29%; four weeks −0.60%; three months +19.77%.
Taiwan — EWT: One week −1.74%; four weeks +3.07%; three months +7.65%.
S&P 500 — SPY: One week +1.16%; four weeks +1.87%; three months +3.13%.
Nasdaq-100 — QQQ: One week +0.23%; four weeks +5.09%; three months +3.55%.
Gold — GLD: One week +1.17%; four weeks −3.56%; three months +2.01%.
Silver — SLV: One week +0.07%; four weeks −5.75%; three months +1.54%.
Canada — EWC: One week +0.53%; four weeks −2.56%; three months +0.65%.
Long-duration Treasuries — TLT: One week +0.65%; four weeks −3.57%; three months −7.31%.
U.S. dollar — UUP: One week +0.45%; four weeks +3.38%; three months +2.22%.
Rising columns have recovered further than buy signals
The S&P 500’s X-column participation has improved more than its buy-signal participation over the four-week comparison. X-column participation measures the proportion of charts currently in rising X-columns. The Bullish Percent Index (BPI) measures the proportion retaining Point & Figure (P&F) buy signals. A rising column can form while a chart still retains a sell signal; the measures therefore need not move together.
X-column participation
Changes are expressed in percentage points (pp).
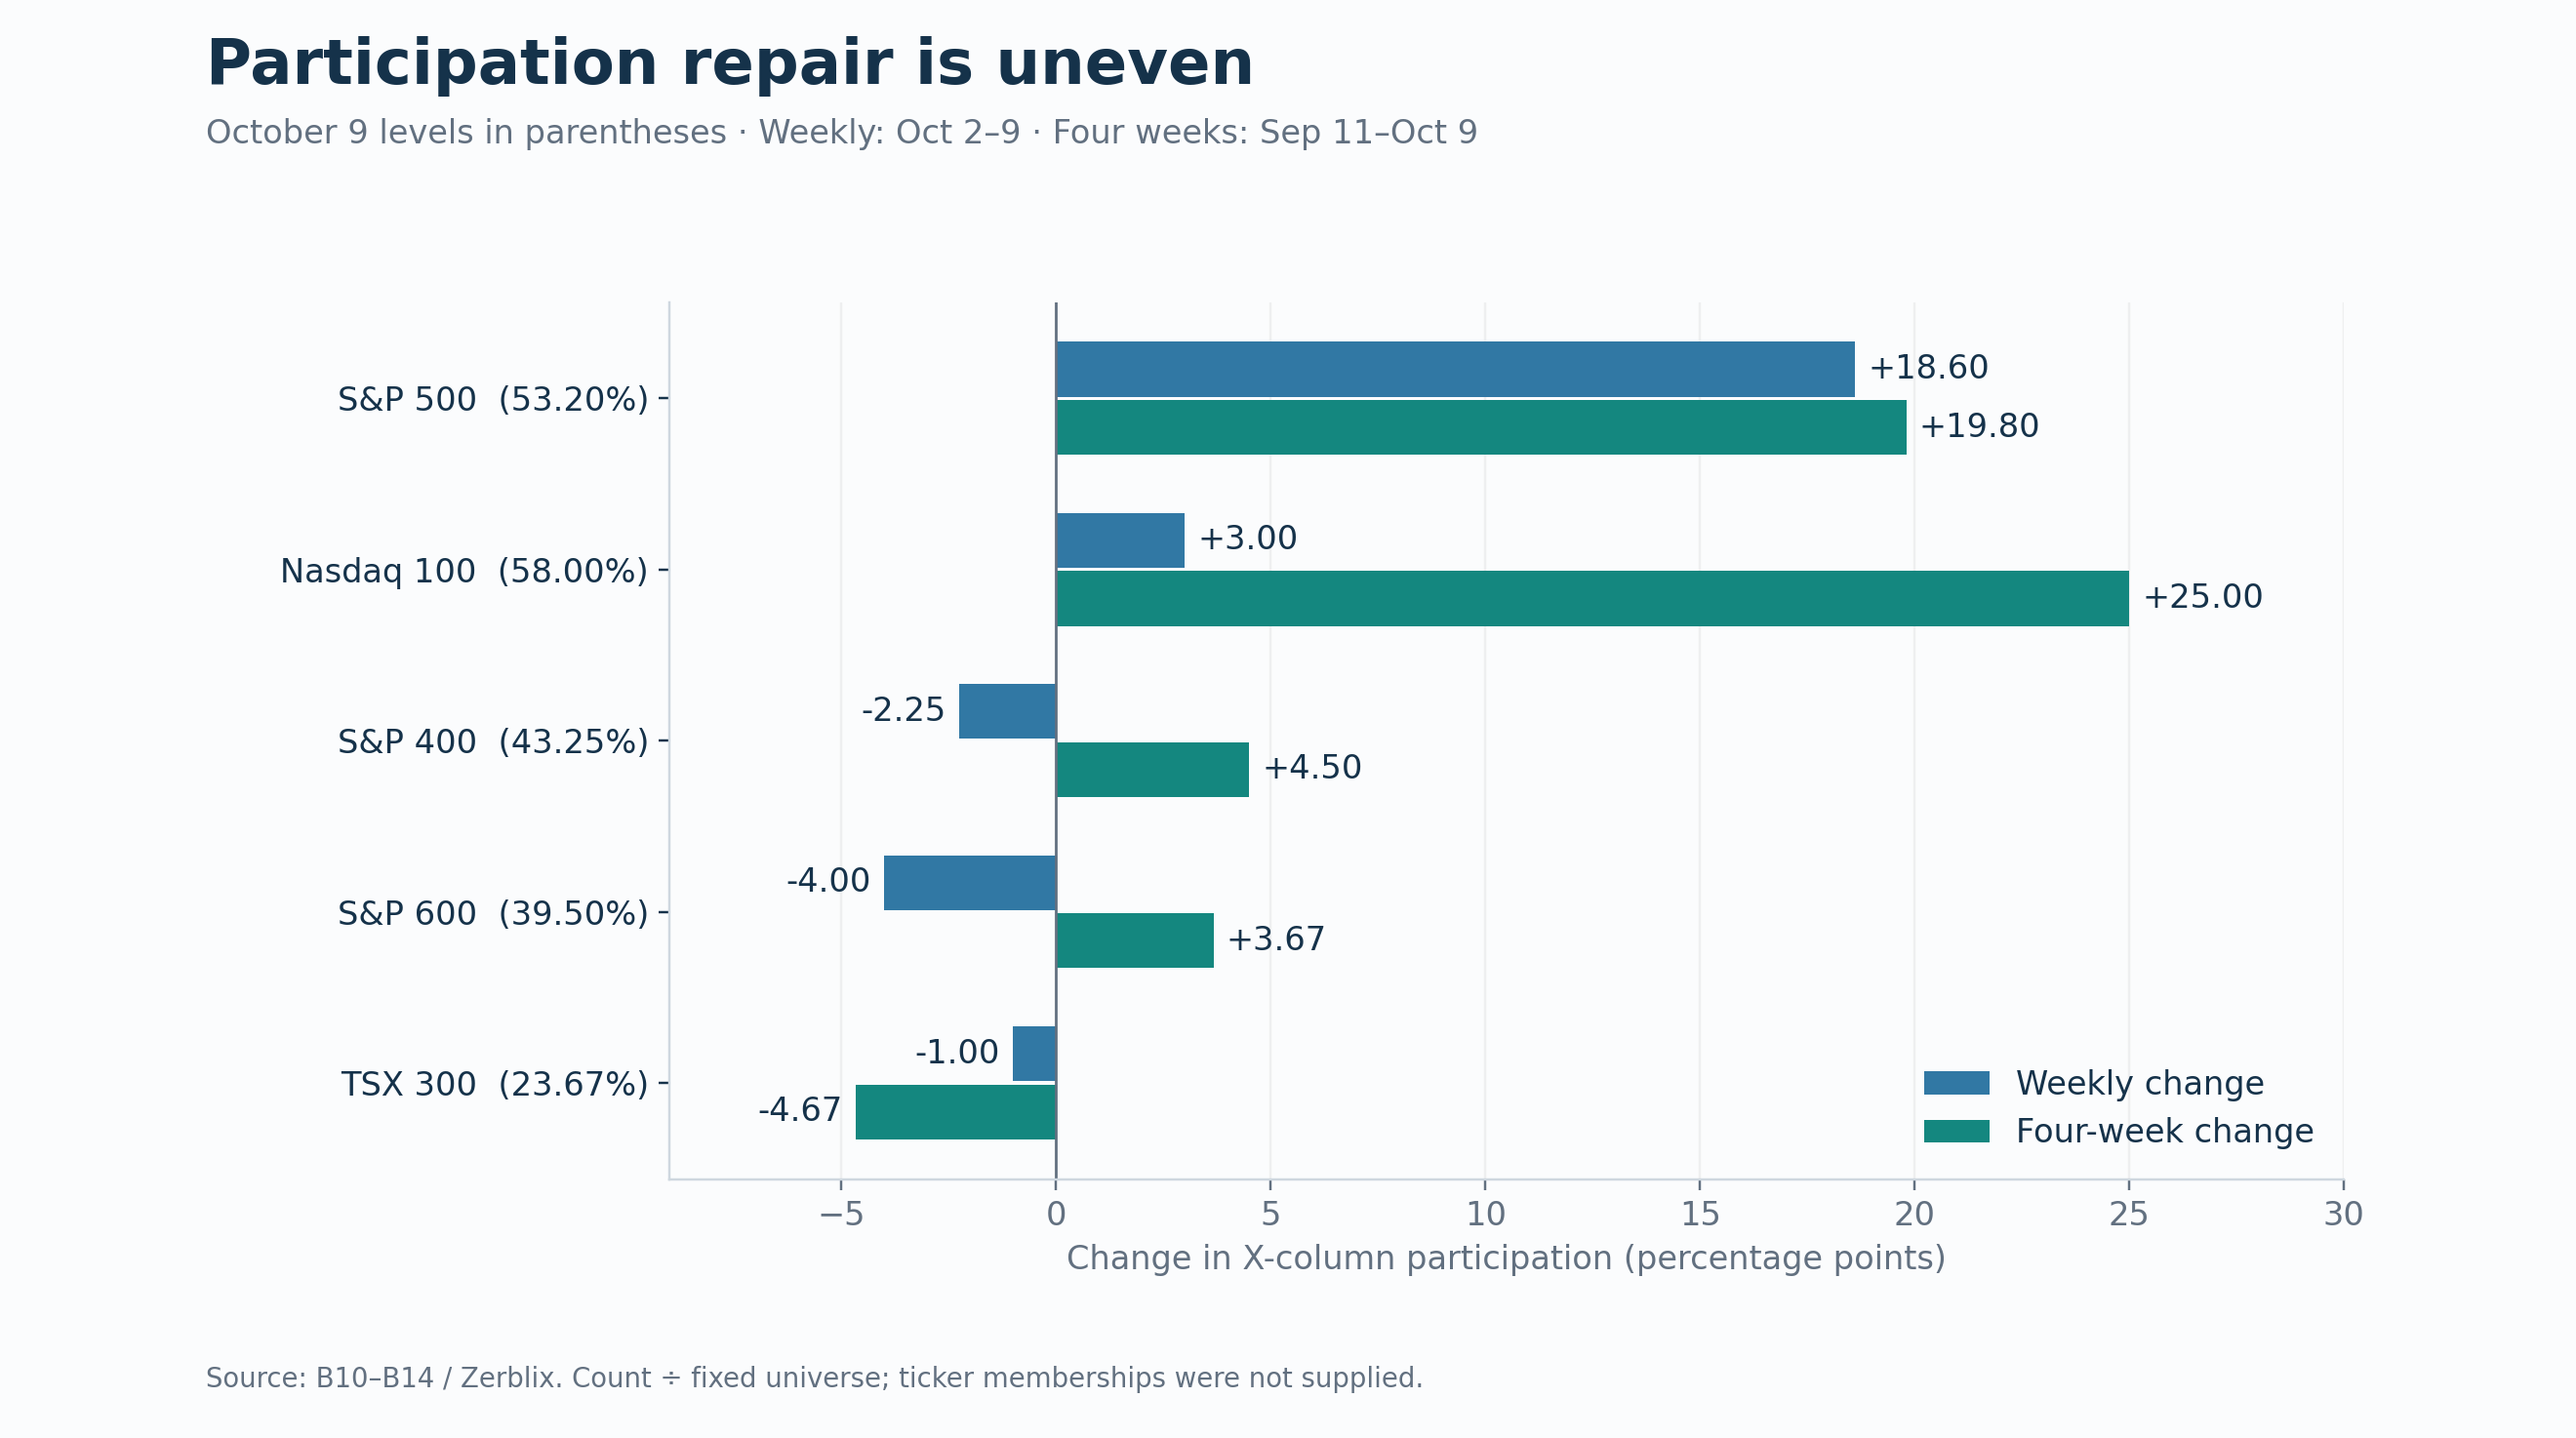
S&P 500: Current participation 53.20%; weekly change +18.60 pp; four-week change +19.80 pp.
Nasdaq-100: Current participation 58.00%; weekly change +3.00 pp; four-week change +25.00 pp.
S&P 400: Current participation 43.25%; weekly change −2.25 pp; four-week change +4.50 pp.
S&P 600: Current participation 39.50%; weekly change −4.00 pp; four-week change +3.67 pp.
TSX 300: Current participation 23.67%; weekly change −1.00 pp; four-week change −4.67 pp.
Changes are percentage points (pp). Counts reconcile to the workbook’s fixed denominators; constituent ticker lists were not supplied for these X-column snapshots.
The S&P 500 now records 53.20% in X-columns. Its BPI stands at 35.40%, up 3.60 points weekly, but down 7.80 points over four weeks. Demand has reversed more charts upward without restoring the extent of buy-signal participation recorded at the monthly baseline.
Mid-cap and small-cap X-column participation contracted during the latest week, although both remain above September 11. This describes a setback within monthly repair. All eight main-group BPI readings remain below 50%.
Further participation gains accompanied by expanding buy signals would strengthen the recovery. Renewed reversals into O-columns would weaken it.
QQQ: constructive price performance, incomplete breadth confirmation
QQQ’s price gains have incomplete breadth confirmation
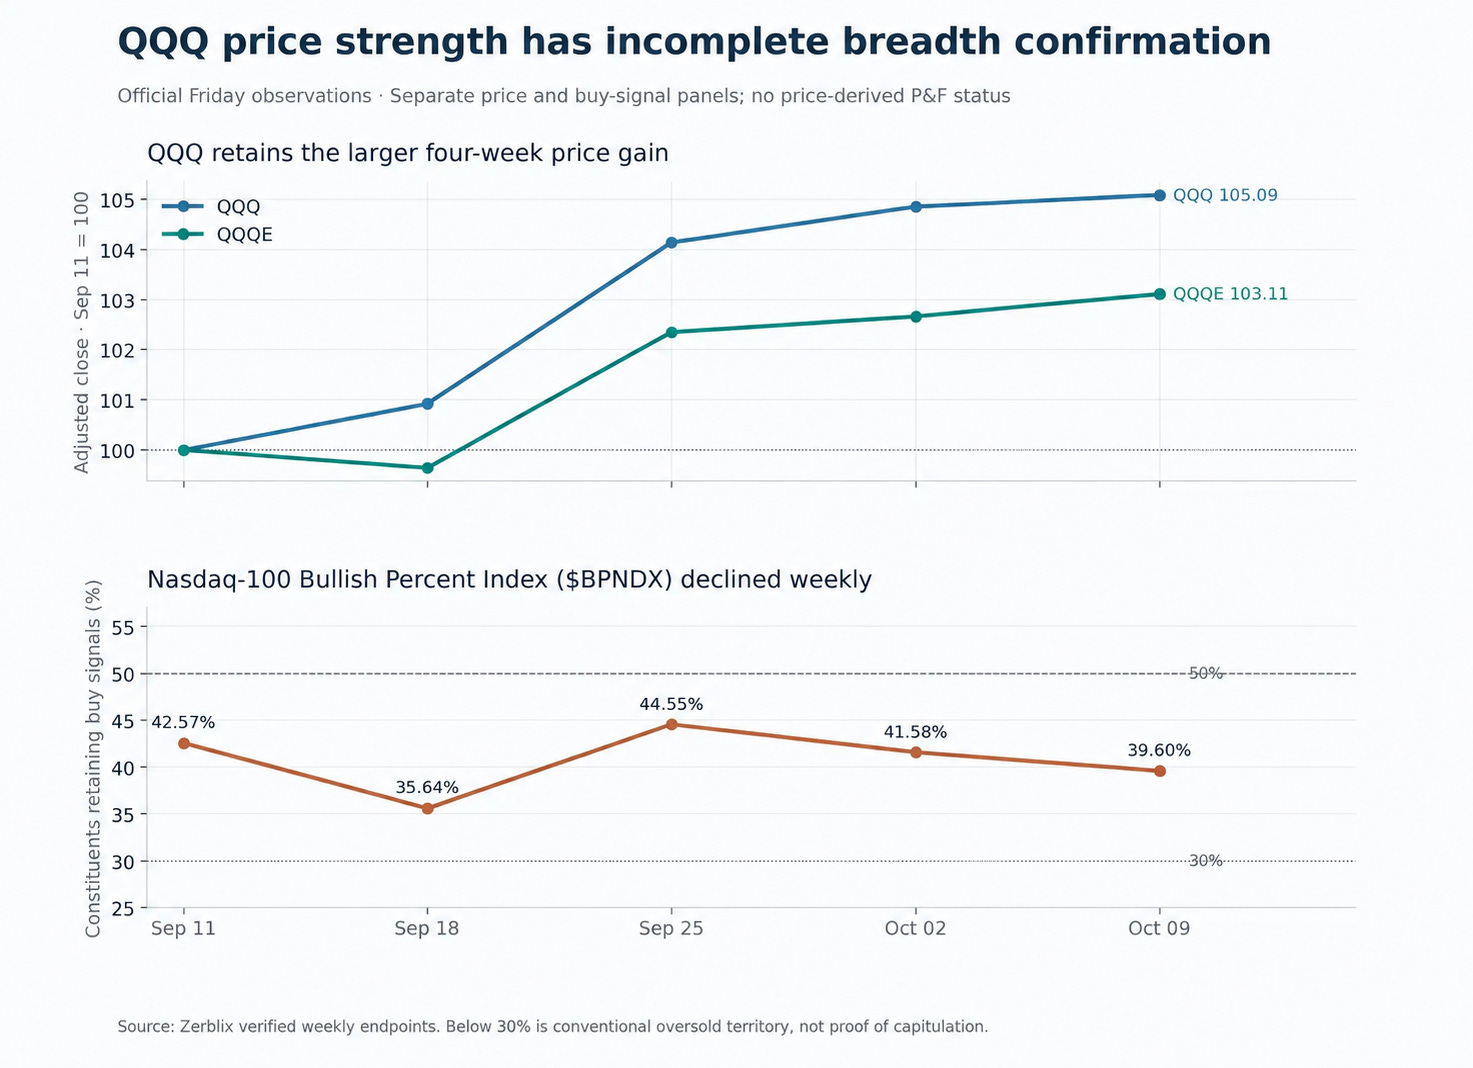
At the October 9 Official Friday close, QQQ was up 0.23% for the week and 5.09% over four weeks. Equal-weight QQQE gained 0.44% for the week, but its four-week advance was smaller at 3.11%. The latest week favored equal weight; the longer price window still favored QQQ.
The underlying point-and-figure measures are divided. Nasdaq-100 X-column participation rose to 58%, up 3 percentage points from the prior Friday and 25 points over four weeks. Yet the Nasdaq-100 Bullish Percent Index ($BPNDX) fell to 39.60%, down 1.98 points for the week and 2.97 points over four weeks.
X-column participation rose, while the share on P&F buy signals fell. An upward column reversal can precede a breakout above the prior X-column high. The test now is whether rising participation produces more buy signals. A recovery in $BPNDX would strengthen confirmation; continued erosion would leave QQQ’s price advance more exposed.
$BPNDX remains above the conventional 30% oversold threshold. Neither the current reading nor a future move below 30% would, on its own, establish capitulation or a completed bottom.
Brazil: the clearest price-led standout
Brazil’s advance has strengthened an already positive intermediate price position. EWZ gained 14.01% during the week, bringing its three-month advance to 21.18%. Its four-week gain is also 14.01%, reflecting identical adjusted closes at the October 2 and September 11 baselines.
EWZ finished at its highest Friday adjusted close in the retained trailing 52-week window. This places the latest advance at the upper boundary of that weekly price history. Confirmation of a specific P&F breakout still requires the chart itself. EWZS, the Brazil small-cap exposure, also appears in the eligible core leadership screen, providing a second Brazilian exposure for investigation without establishing market-wide participation.
Taiwan retains intermediate gains but weakened during the latest week. EWT declined 1.74%, while remaining 3.07% higher over four weeks and 7.65% higher over three months. Brazil’s latest advance and Taiwan’s weekly reaction distinguish their immediate price behavior despite positive three-month returns in both.
For EWZ, the next reaction will help assess the advance. A subsequent P&F buy signal that survives that reaction would strengthen chart confirmation. Sustained weakness in EWZ/SPY would indicate erosion of relative leadership; a P&F sell signal would provide additional evidence of supply overcoming demand.vival conclusion is assigned from these price snapshots.
Broad commodities differ from gold and silver
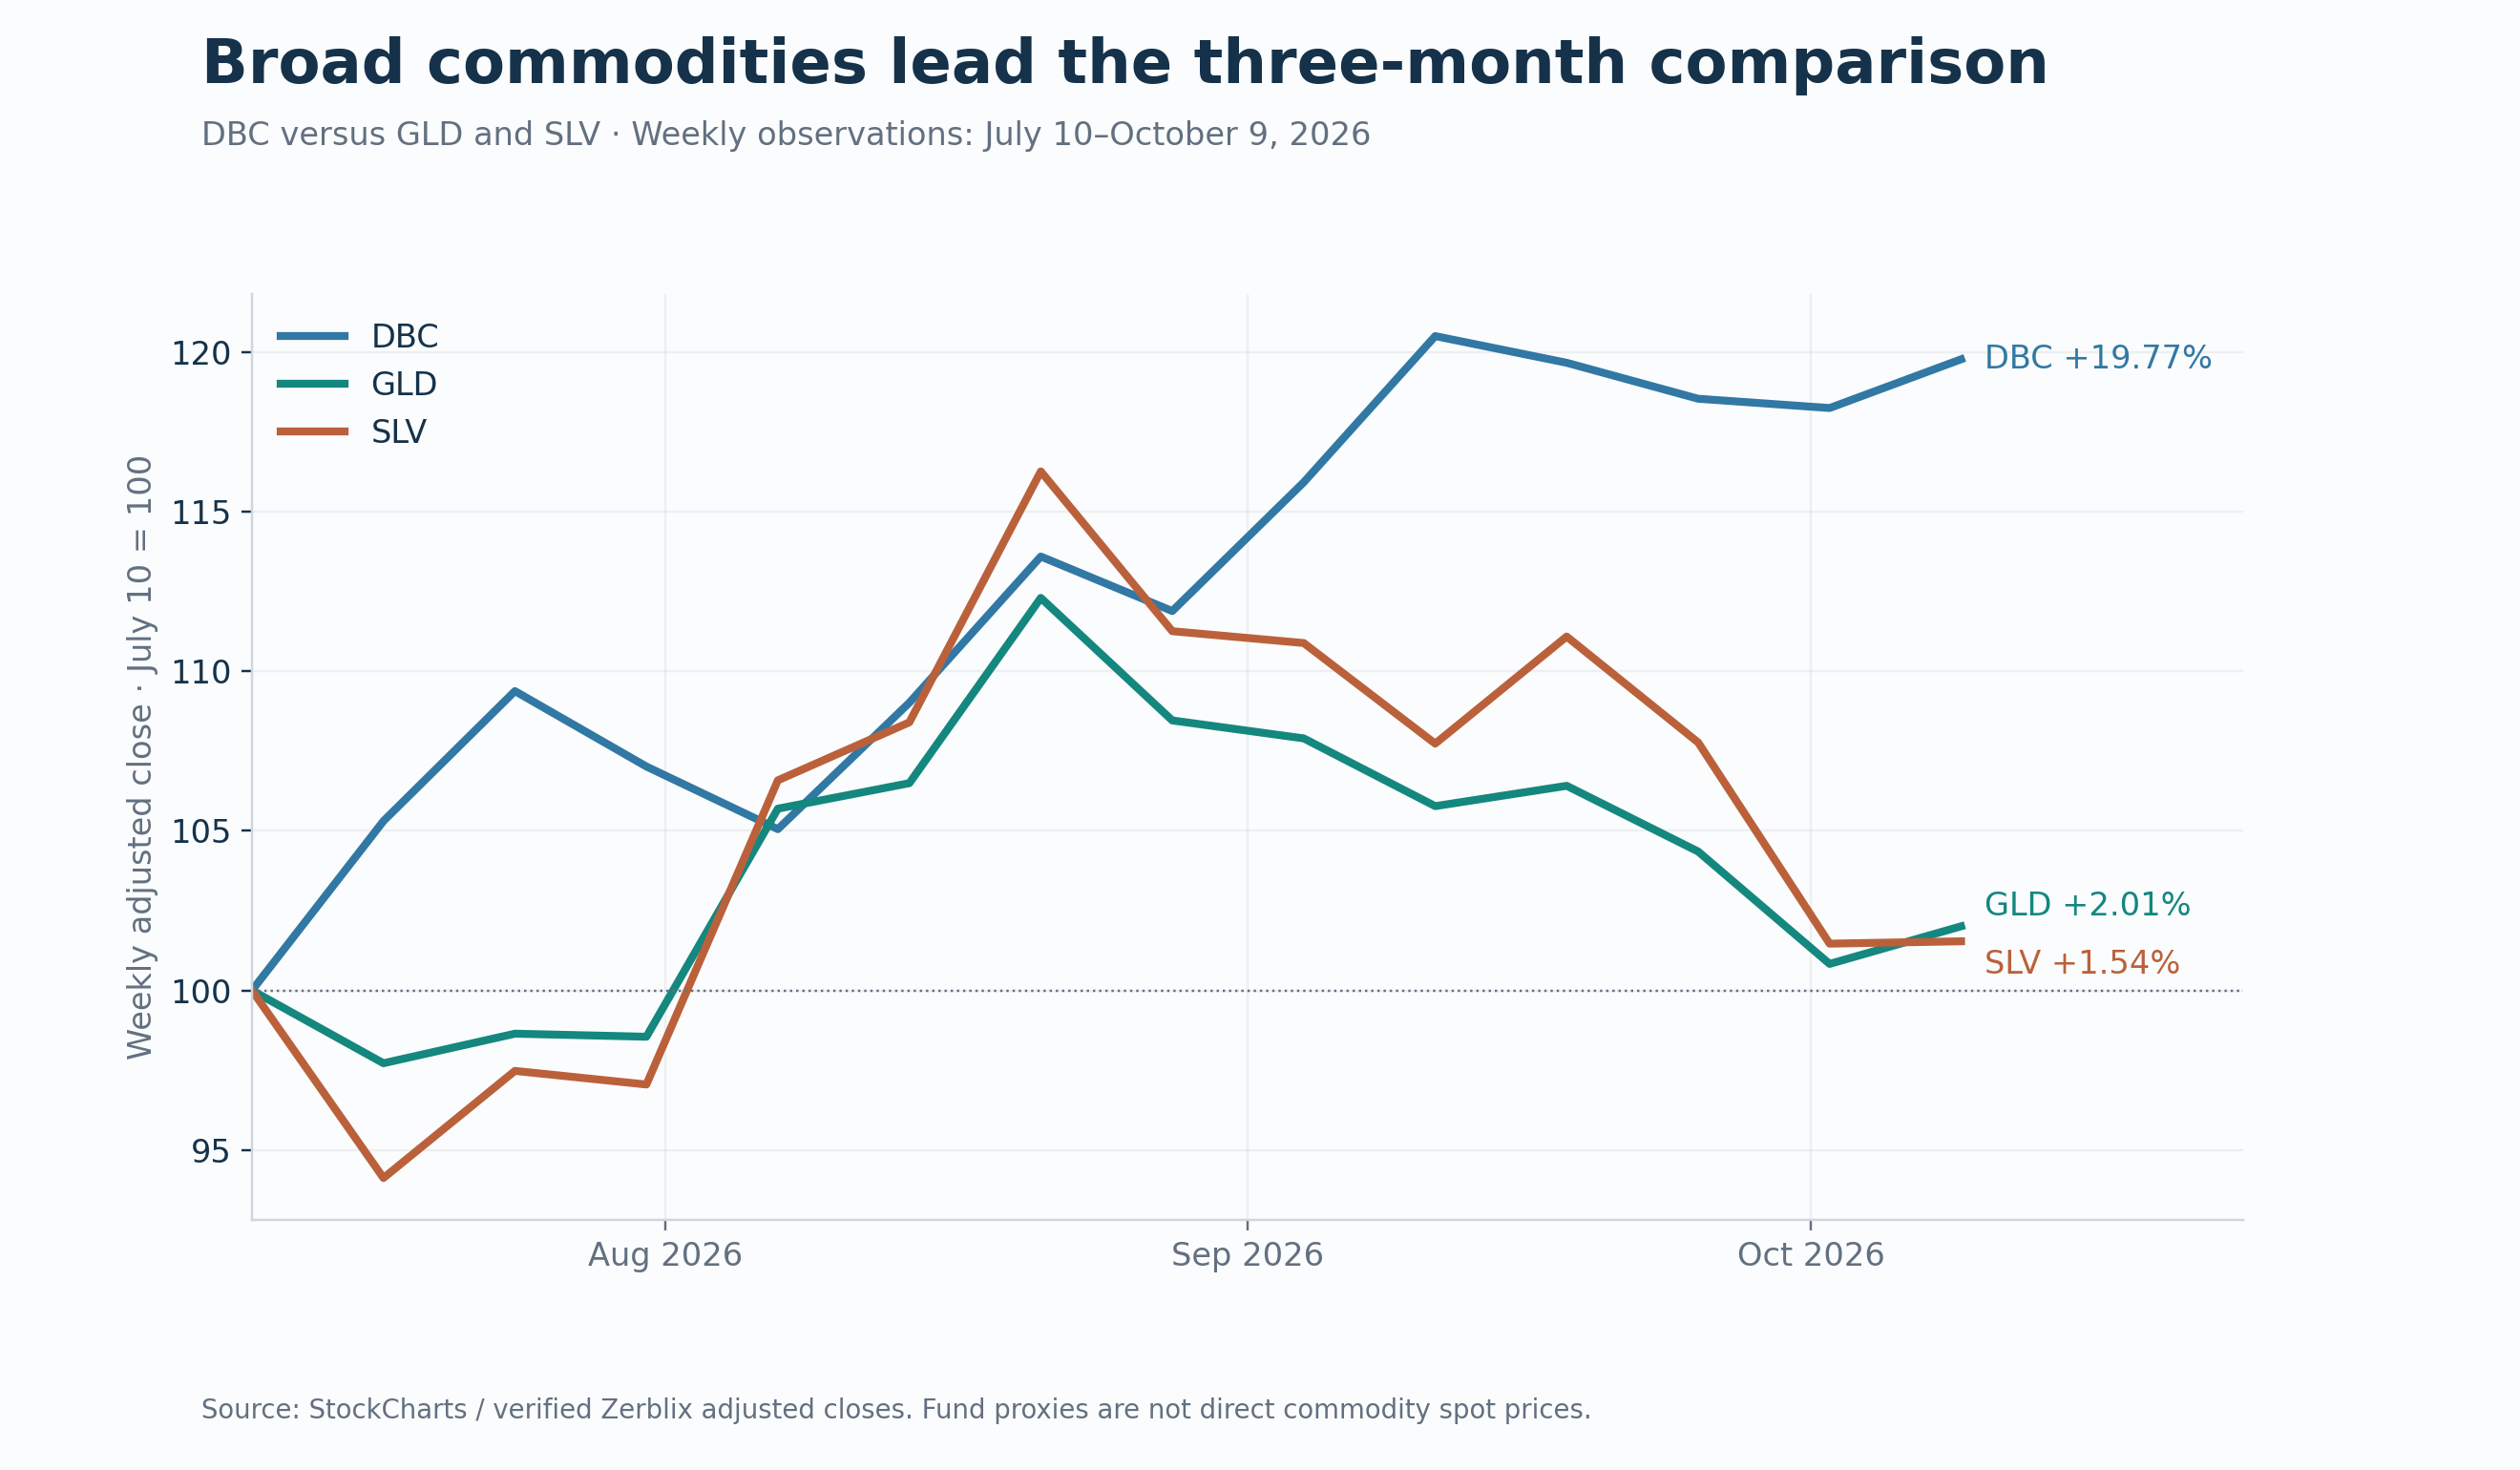
The figures support a clear point: DBC has led over three months, but that strength has not carried through the past four weeks. GLD and SLV have also weakened over four weeks despite small gains in the latest week. I verified the return periods against the October 9 Official Friday workbook.
DBC (broad commodities): Three months +19.77%; four weeks −0.60%; latest week +1.29%.
GLD (gold): Three months +2.01%; four weeks −3.56%; latest week +1.17%.
SLV (silver): Three months +1.54%; four weeks −5.75%; latest week +0.07%.
Revised passage
Broad commodities lead, but recent participation is less convincing. DBC gained 19.77% over three months, well ahead of gold fund GLD (2.01%) and silver fund SLV (1.54%). Yet DBC remains 0.60% lower over four weeks, even after a 1.29% gain in the latest week. The larger advance is intact over three months, while the shorter window shows that momentum has moderated.
The precious-metals funds show a weaker recent structure. GLD rose 1.17% in the latest week but remained 3.56% lower over four weeks. SLV’s 0.07% weekly gain left it 5.75% lower over the same four-week period. Those weekly gains have not yet established a sustained recovery. Further gains that repair the four-week losses would strengthen the case for renewed demand; another decline would leave the recent weakness in place.
The longer view is different: GLD gained 134.17% and SLV 161.48% from October 8, 2021, to October 9, 2026, on the workbook’s adjusted-close basis. Their current four-week declines should be read within that longer advance.
Energy and Technology: leadership with different qualifications
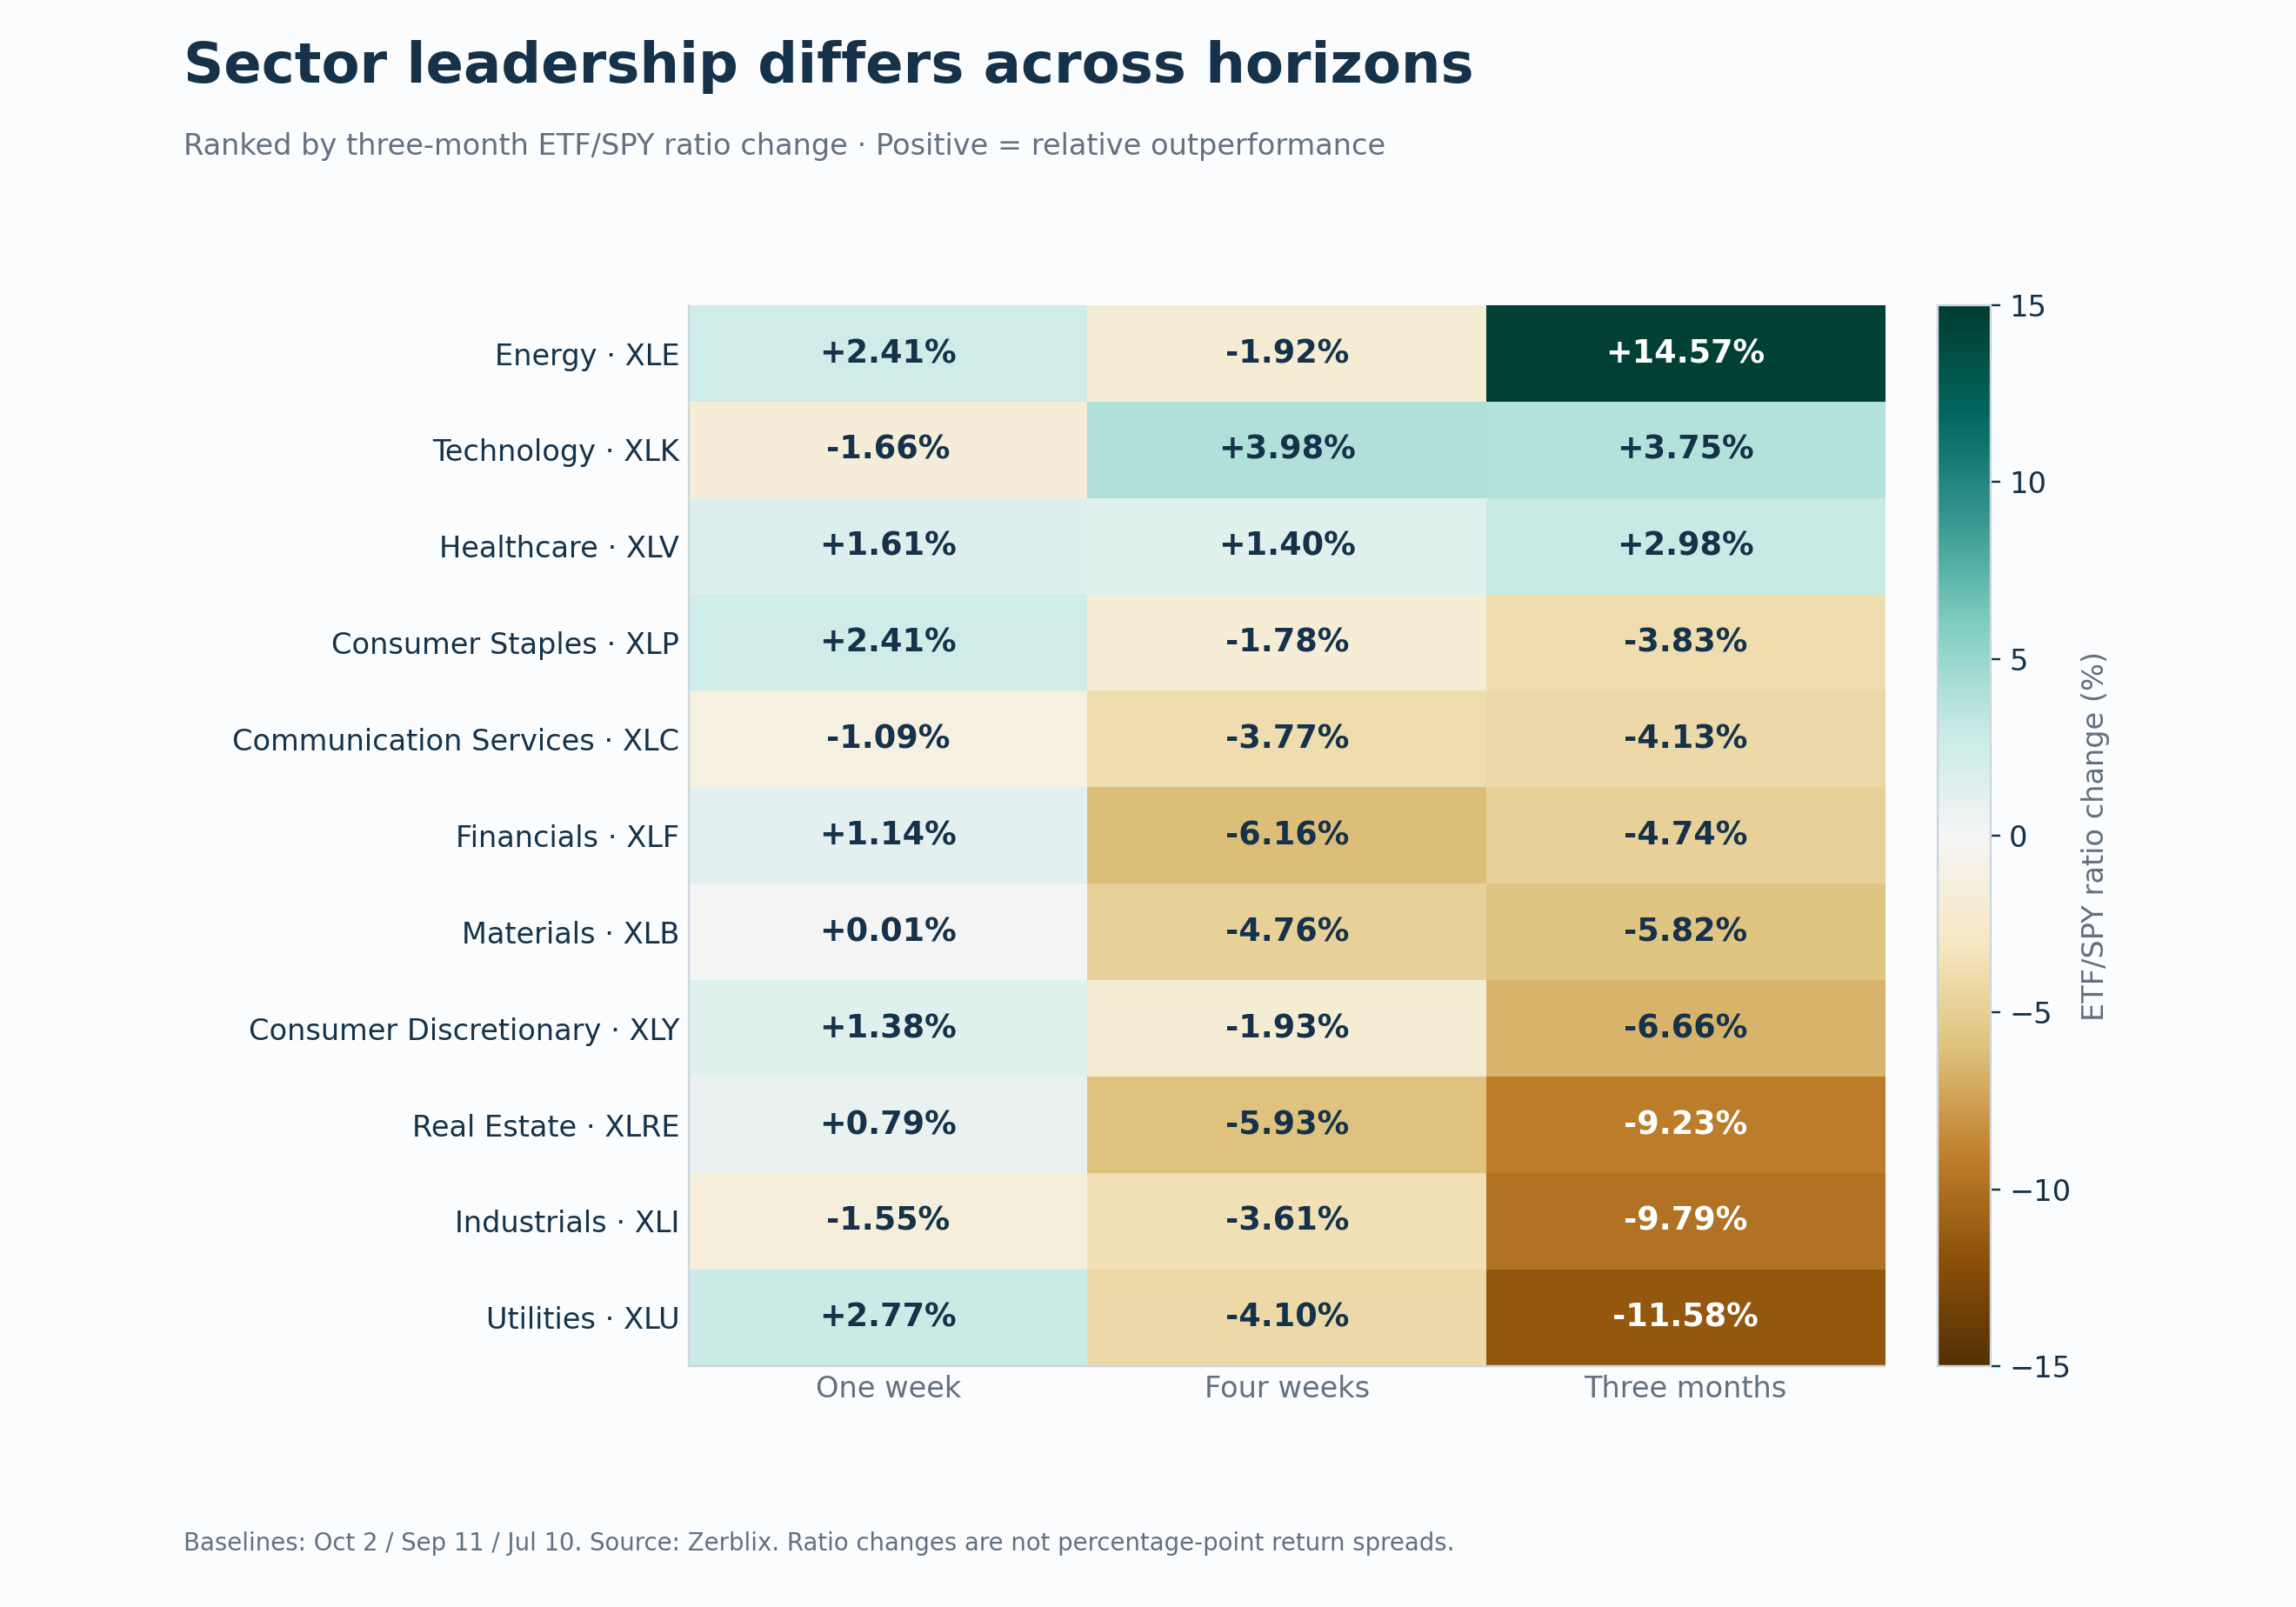
Relative strength (RS) here means the change in an ETF-to-SPY adjusted-close ratio. Positive RS indicates relative outperformance over the stated period; it does not establish a P&F RS buy signal. Ratio changes are distinct from percentage-point differences between ETF and SPY returns.
Energy leads the eleven sectors in three-month relative strength, but its breadth recovery remains partial. The XLE/SPY ratio gained 14.57% over three months and 2.41% during the latest week, while remaining 1.92% lower over four weeks.
Energy’s Bullish Percent Index (BPI) rose from 38.10% to 52.38% during the week, restoring a modest majority of constituents to P&F buy signals. Nevertheless, it remains 38.10 percentage points below September 11’s 90.48%. The weekly rebound has recovered some lost participation, while the four-week comparison still shows substantial deterioration.
Technology’s relative performance and breadth diverged during the week. The XLK/SPY ratio declined 1.66%, although its 3.98% four-week gain and 3.75% three-month gain remained intact. Technology’s BPI increased over both the weekly and four-week comparisons. Buy-signal participation therefore improved even as XLK lost ground against SPY during the latest week.
Sector Bullish Percent Index (BPI)
Changes are expressed in percentage points (pp).
Technology: Current BPI 57.75%; weekly change +2.82 pp; four-week change +8.45 pp; Friday daily change 0.00 pp. Workbook classification: Unclassified.
Energy: Current BPI 52.38%; weekly change +14.28 pp; four-week change −38.10 pp; Friday daily change 0.00 pp. Workbook classification: Unclassified.
Communication Services: Current BPI 43.59%; weekly change −5.13 pp; four-week change −1.41 pp; Friday daily change −2.56 pp. Workbook classification: Unclassified.
Friday’s daily BPI changes compare October 8 with October 9 and are separate from weekly changes. BPI levels alone do not establish Bull Confirmed or Bear Confirmed status.
The eligible core leadership screen includes BUG, CIBR, CLOU, FDN, IGV and SKYY, highlighting software, cybersecurity, cloud and internet exposures. These funds have overlapping holdings and themes, so six matches do not represent six independent sources of breadth confirmation. They are leadership-screen matches, not necessarily fresh Friday breakouts.
Technology retains positive relative performance over four weeks and three months, despite its weekly setback. The next test is whether XLK resumes outperforming SPY while Technology’s buy-signal participation continues to expand. Further weakness in the XLK/SPY ratio, accompanied by a declining sector BPI, would indicate deterioration in both relative performance and participation.
Healthcare contrasts with Communication Services
Healthcare has positive RS across all three rotation horizons. XLV/SPY rose 1.61% weekly, 1.40% over four weeks and 2.98% over three months. The alignment makes Healthcare a worthwhile chart-review candidate, although ratio performance alone does not establish an active P&F buy signal.
Communication Services shows the opposite alignment. XLC/SPY declined 1.09% weekly, 3.77% over four weeks and 4.13% over three months. Its BPI also fell during the week. Relative price weakness and contracting buy-signal participation point in the same direction.
Real Estate supplies another qualification. XLRE/SPY’s 0.79% weekly gain remains inside declines of 5.93% over four weeks and 9.23% over three months. The latest gain is insufficient to establish that intermediate relative deterioration has reversed. Sustained ratio improvement reinforced by chart repair would strengthen that interpretation.
Canada: fresh demand without broad participation repair
Canada: Friday Breakouts, Weaker Participation
Canada’s Friday scans recorded six fresh Double Top breakouts against two Double Bottom breakdowns, a +4 event balance. This describes Friday’s activity, not the full week. SU.TO and WPM.TO are Energy and precious-metals candidates for individual chart review.
The positive signal flow sits within weaker participation. TSX 300 X-column participation was 23.67%, down 1.00 percentage point over the week and 4.67 points over four weeks. Separately, the TSX Composite Bullish Percent Index was 48.84%, down 0.46 point weekly and 6.51 points over four weeks. These indicators use different constituent universes.
Friday’s breakouts identify pockets of demand, while both breadth series remain below their earlier readings. The evidence supports selective chart investigation; broader Canadian improvement is not yet established.
The next confirmation tests
The next tests are whether Brazil’s price leadership is supported by its P&F chart structure, whether Energy’s improvement in buy-signal participation continues, and whether Technology retains its relative leadership after the weekly setback. Within the Nasdaq-100, a rising proportion of stocks on P&F buy signals would strengthen the breadth confirmation behind QQQ’s positive price performance