


Zerblix P&F Market Breadth and Rotation — Through October 16, 2026
Canadian participation has recovered from its early-October low, but the four-week evidence still shows incomplete repair. More stocks occupy rising P&F columns, and bullish signals outnumbered bearish signals on each of the latest three Fridays. Buy-signal breadth, however, remains below its September 18 reading.
Energy provides a useful connection between the market evidence and the economic backdrop. Its strength can support resource producers while higher fuel costs complicate inflation and the outlook for other parts of the economy.
Participation rebounds after three declining Friday observations
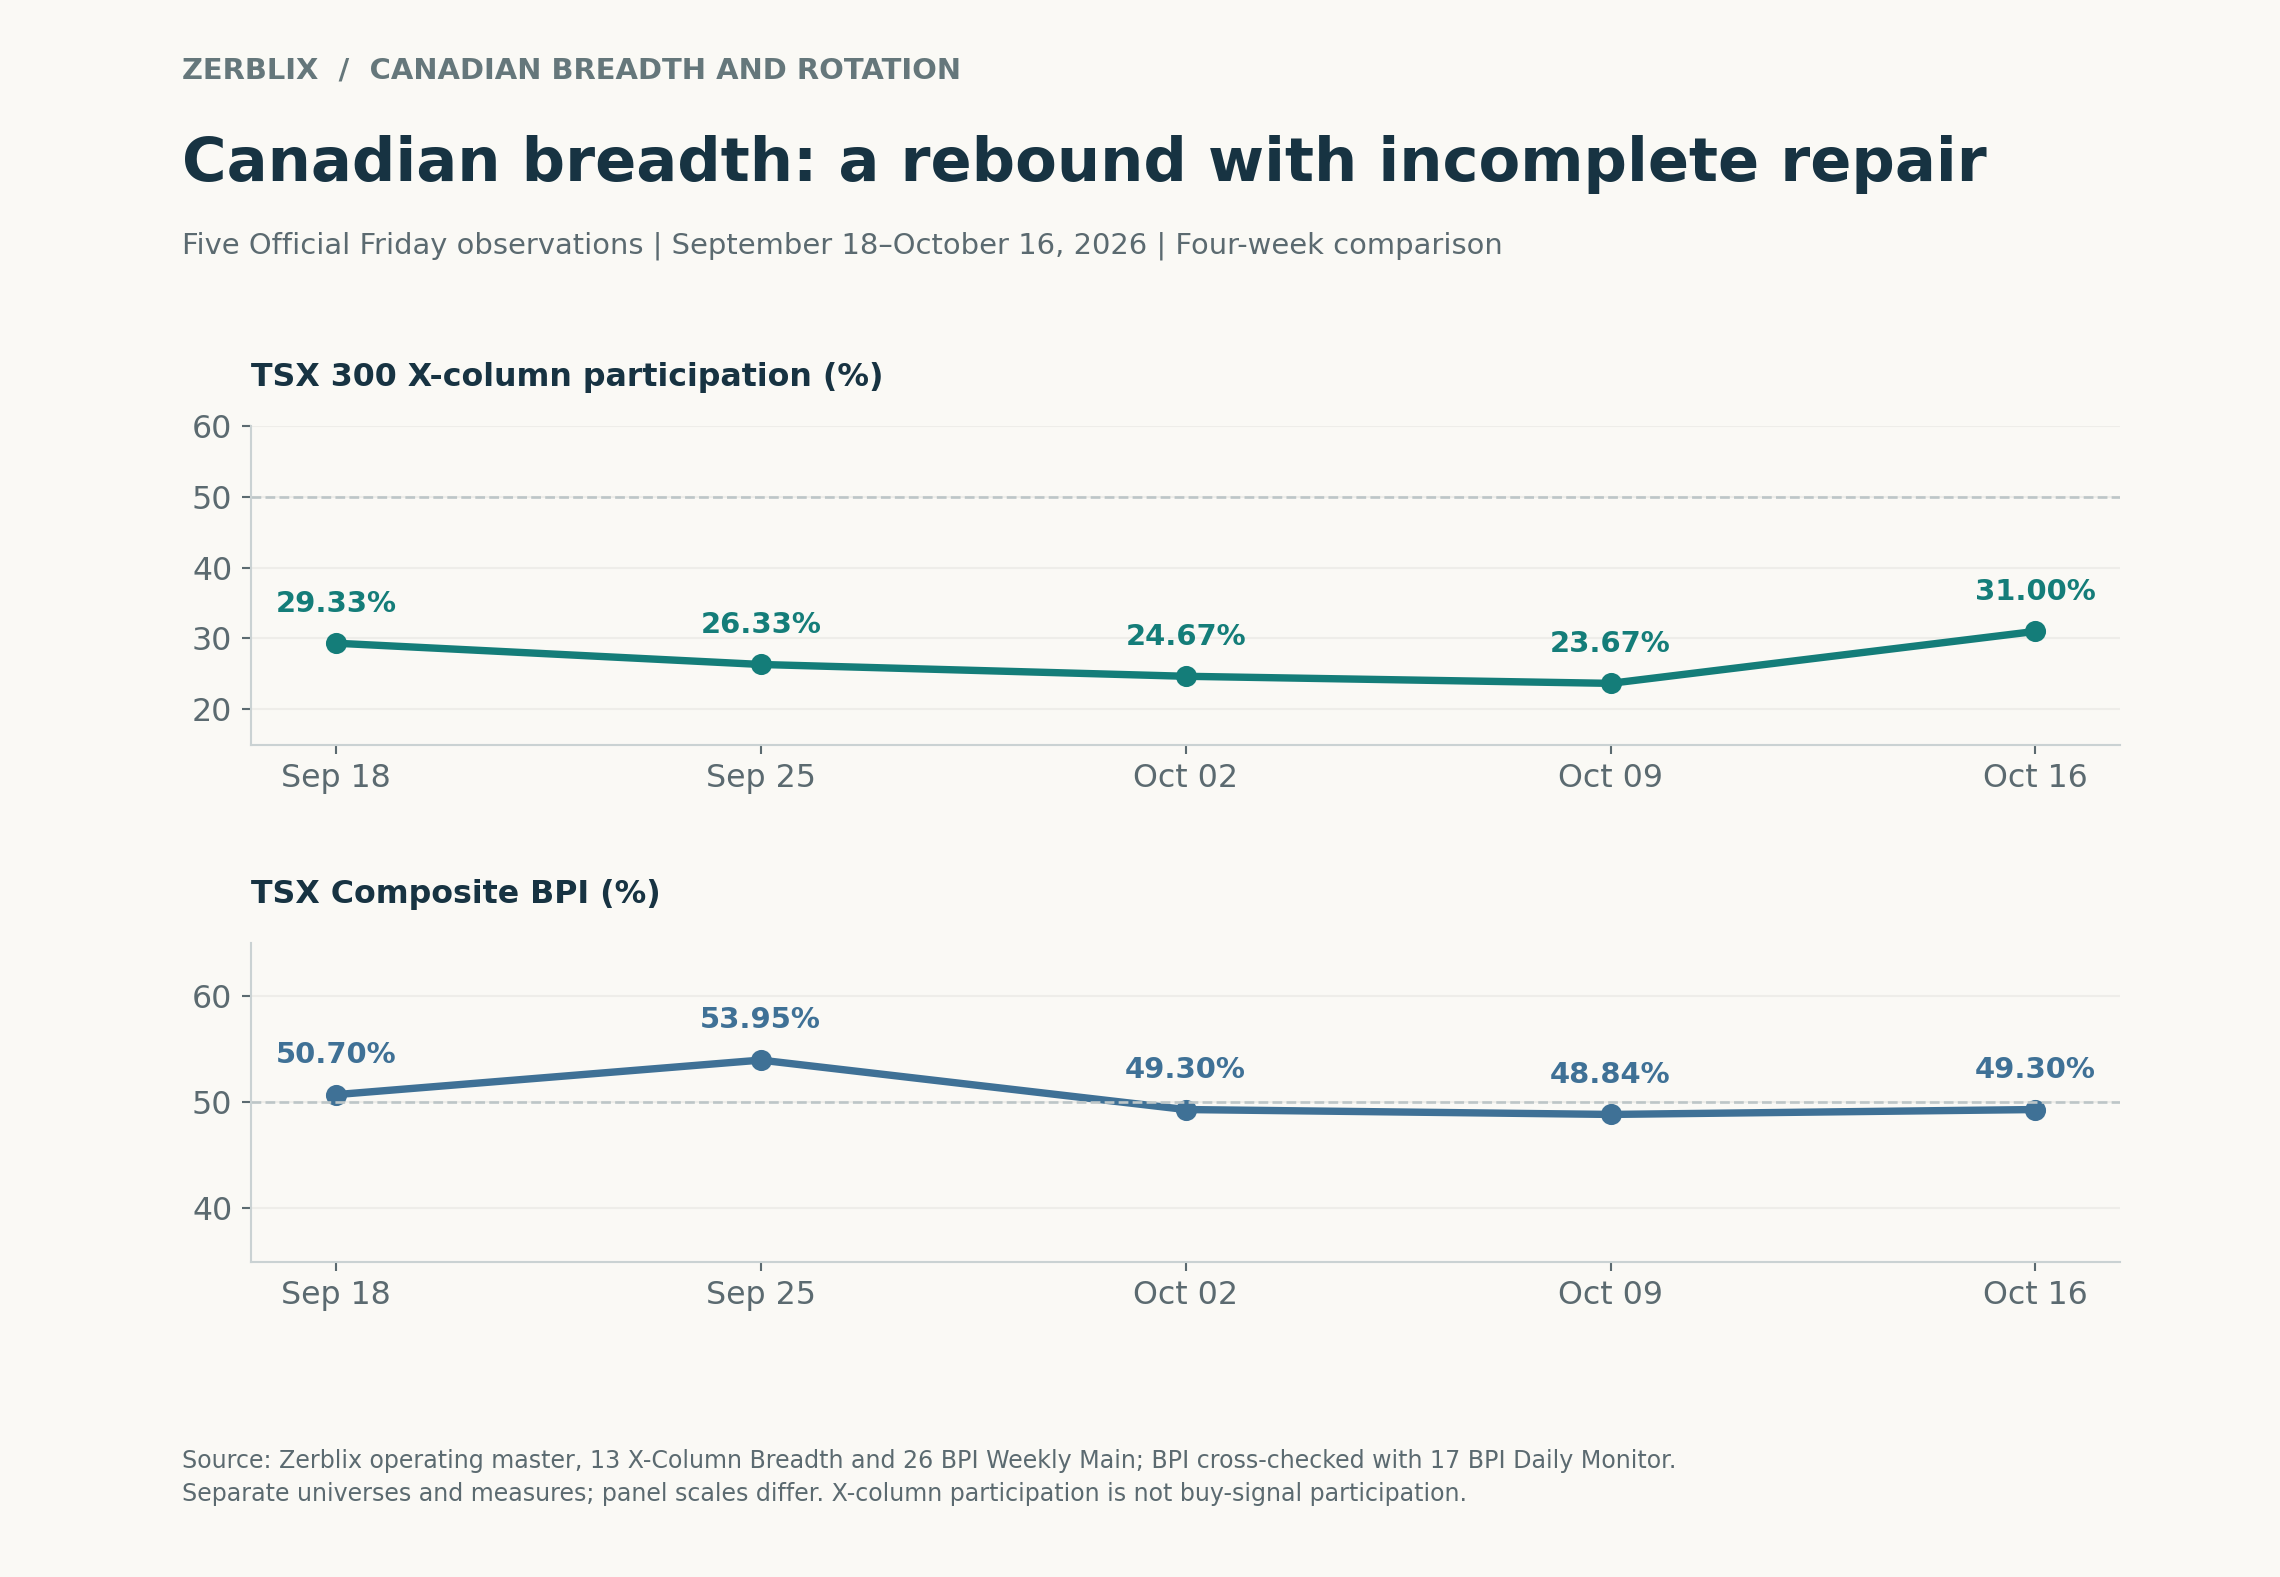
TSX 300 X-column participation declined from 29.33% on September 18 to 23.67% on October 9, before recovering to 31.00% on October 16.
The underlying count fell from 88 stocks to 71, then increased to 93. The latest recovery reversed the preceding decline and lifted participation above its September 18 reading.
The comparison period matters:
October 9–16: participation increased 7.33 percentage points.
September 18–October 16: participation increased 1.67 percentage points.
The weekly rebound was substantial relative to the recent low. Across the full four weeks, net progress was modest.
Demand has regained ground, but the recovery has yet to encompass a majority of the tracked universe. Sustained expansion through subsequent reactions would strengthen the interpretation. A renewed contraction would suggest that the latest improvement lacks persistence.
Buy-signal breadth still requires structural repair
The TSX Composite Bullish Percent Index declined from 50.70% on September 18 to 49.30% on October 16, a four-week decrease of 1.40 percentage points.
BPI initially increased to 53.95% on September 25, then declined before recovering slightly at the latest observation.
These measures retain different meanings:
X-column participation identifies charts currently in rising columns.
BPI identifies the proportion holding P&F buy signals.
A chart can reverse into Xs while retaining a sell signal. Additional progress above the relevant prior X-column high is required to generate a new buy signal.
The TSX 300 scan and TSX Composite BPI also represent separately defined universes. Their readings provide complementary evidence rather than an exact comparison of identical constituents.
The four-week picture is therefore one of modest directional improvement alongside lower buy-signal participation. Further expansion in both measures would provide stronger confirmation of repair.
A modest macro overlay: energy strength carries competing effects
The Bank of Canada maintained its policy rate at 2.25% on September 2, with its next scheduled decision on October 28. (Bank of Canada)
In its September deliberations, the Bank described improving economic activity alongside continued economic slack, heightened trade uncertainty and inflation risks from persistently elevated energy prices. It also noted that Canadian bond yields had risen. (Bank of Canada)
For Zerblix, the implication is selective rather than uniformly bullish. Energy leadership can coexist with a restrained broader market. The macro backdrop gives a reason to examine whether strength extends beyond resource producers; breadth and signal survival determine whether that expansion is occurring.
These economic observations provide context. They do not establish the cause of any individual breakout.
Fresh Friday signals have become more constructive
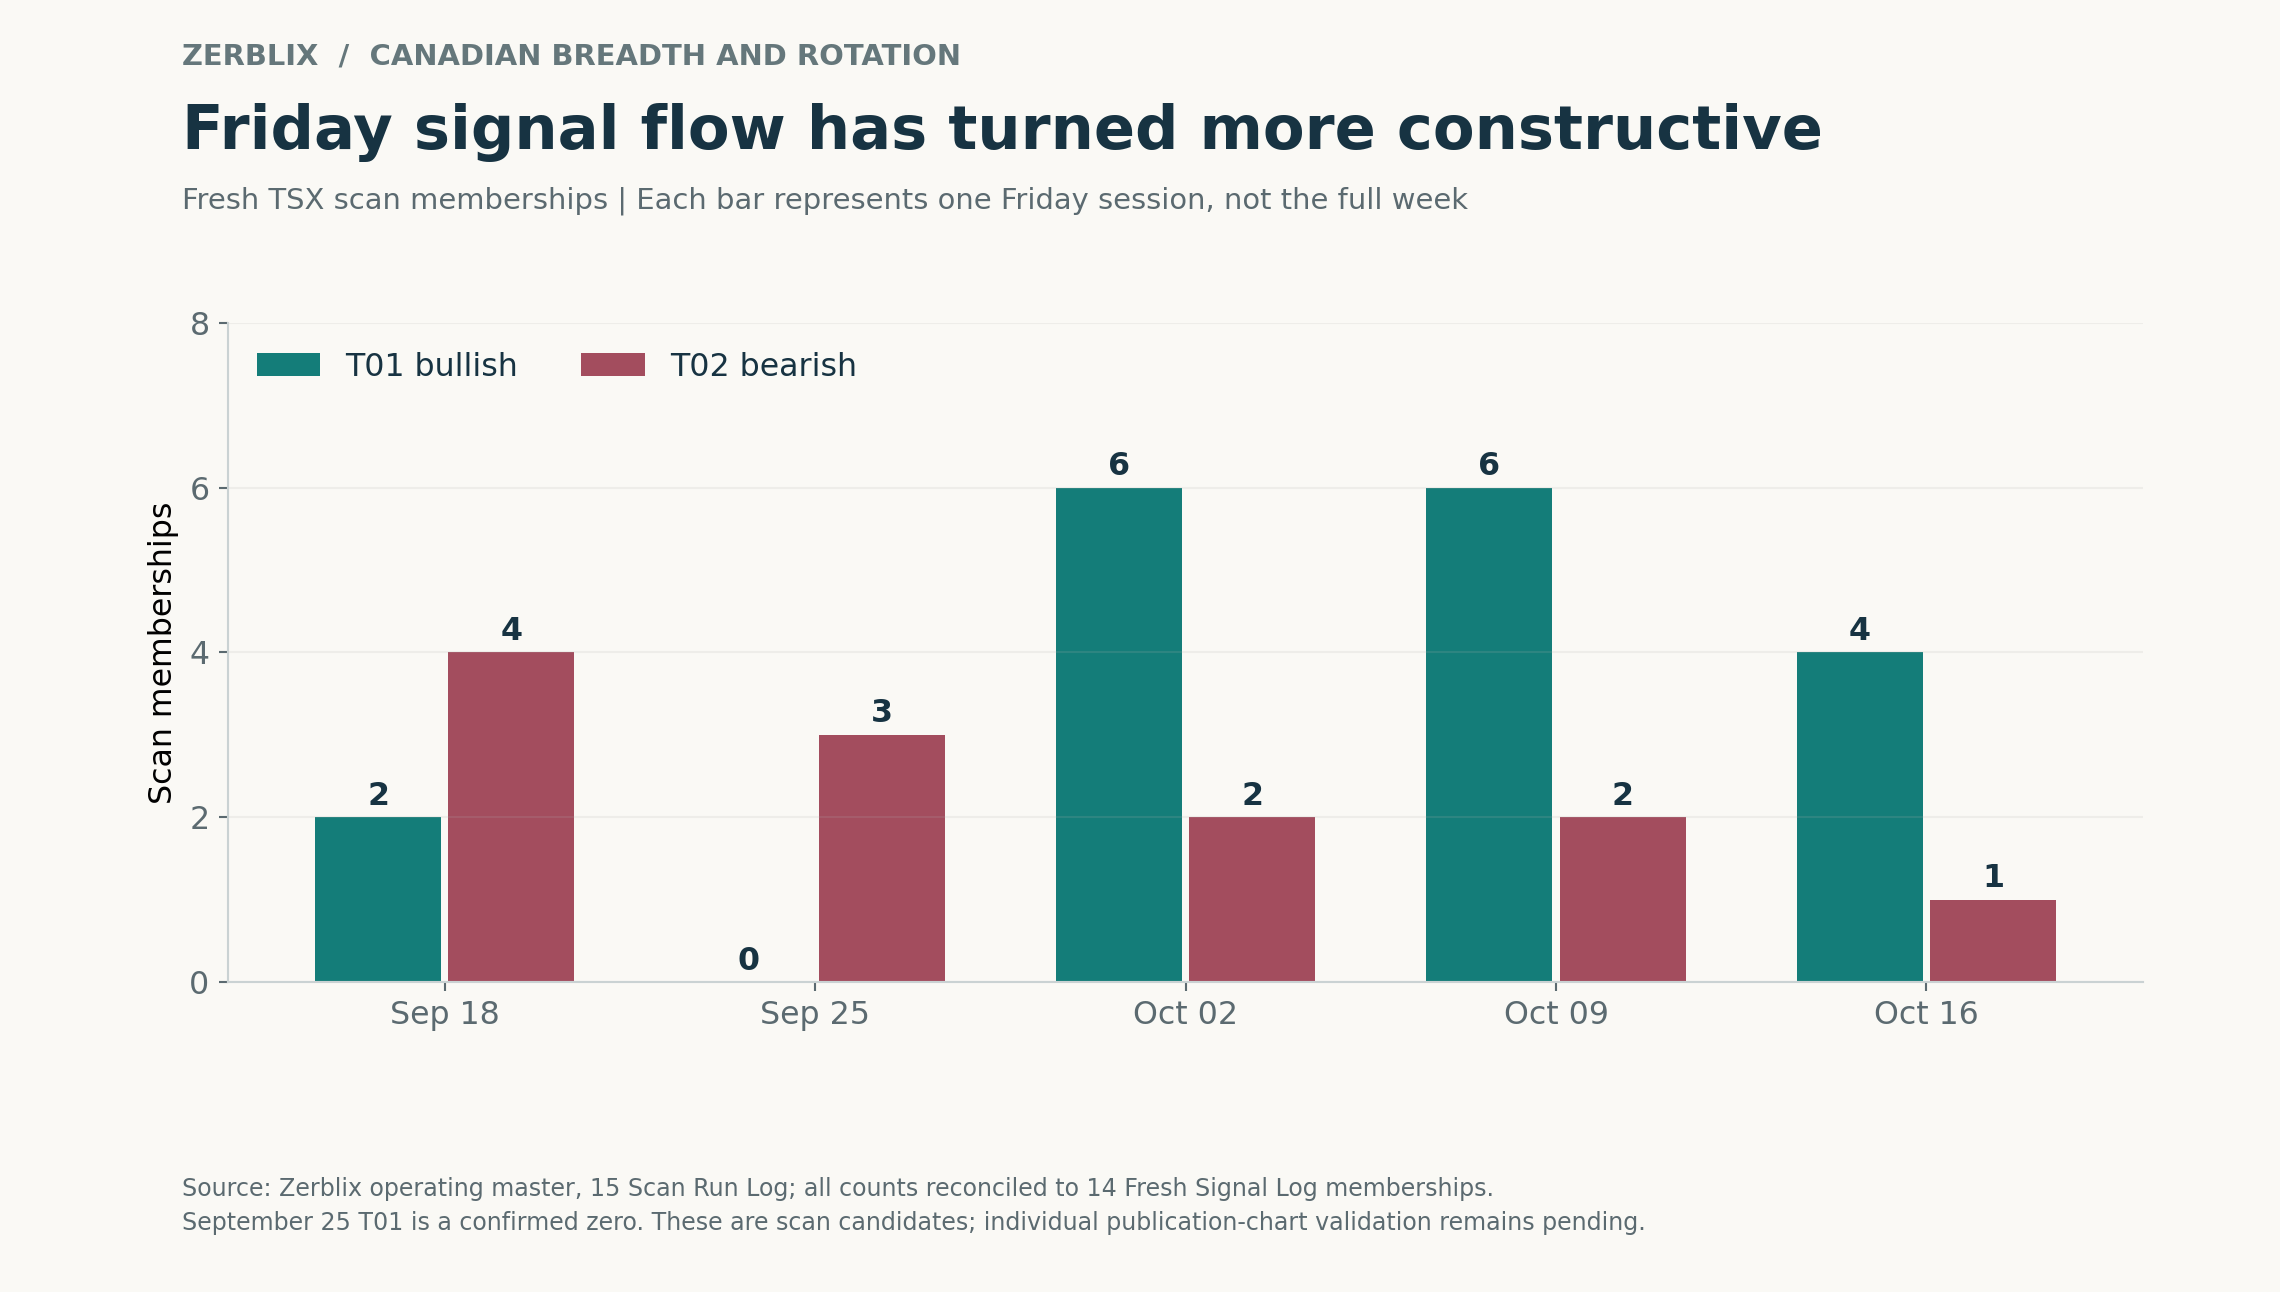
Bearish memberships exceeded bullish memberships on September 18 and September 25. The balance then shifted:
October 2: six bullish and two bearish.
October 9: six bullish and two bearish.
October 16: four bullish and one bearish.
Bullish memberships exceeded bearish memberships on each of the latest three Fridays. That supplies a more constructive reading of newly qualifying signal flow, even while the four-week BPI comparison remains weaker.
Each observation represents that Friday’s session, rather than the full trading week. These are neither complete monthly totals nor counts of unique stocks across the period.
A fresh signal establishes an initial observation. Its ability to hold through a reaction and extend higher determines whether the initial demand develops into sustained follow-through.
Paramount and Baytex illustrate the energy connection
Paramount Resources (POU.TO) and Baytex Energy (BTE.TO) generated fresh bullish breakouts on their traditional three-box reversal P&F charts on October 16.
The two energy producers accounted for half of Friday’s four bullish Canadian scan results. Bombardier and Alimentation Couche-Tard supplied the other bullish memberships; Curaleaf appeared in the bearish scan.
Structurally, the fresh breakouts indicate that demand exceeded the prior X-column highs required by the traditional scans. Their inclusion connects the Canadian stock evidence with the broader energy rotation.
Confirmation requires the signals to survive subsequent reactions and produce additional upside progress. A reversal into a new sell signal would negate the existing bullish signal and weaken the initial interpretation.
The stock examples illustrate where demand is appearing; broader participation must establish whether that strength is spreading.
EWC’s longer record keeps the rebound in perspective
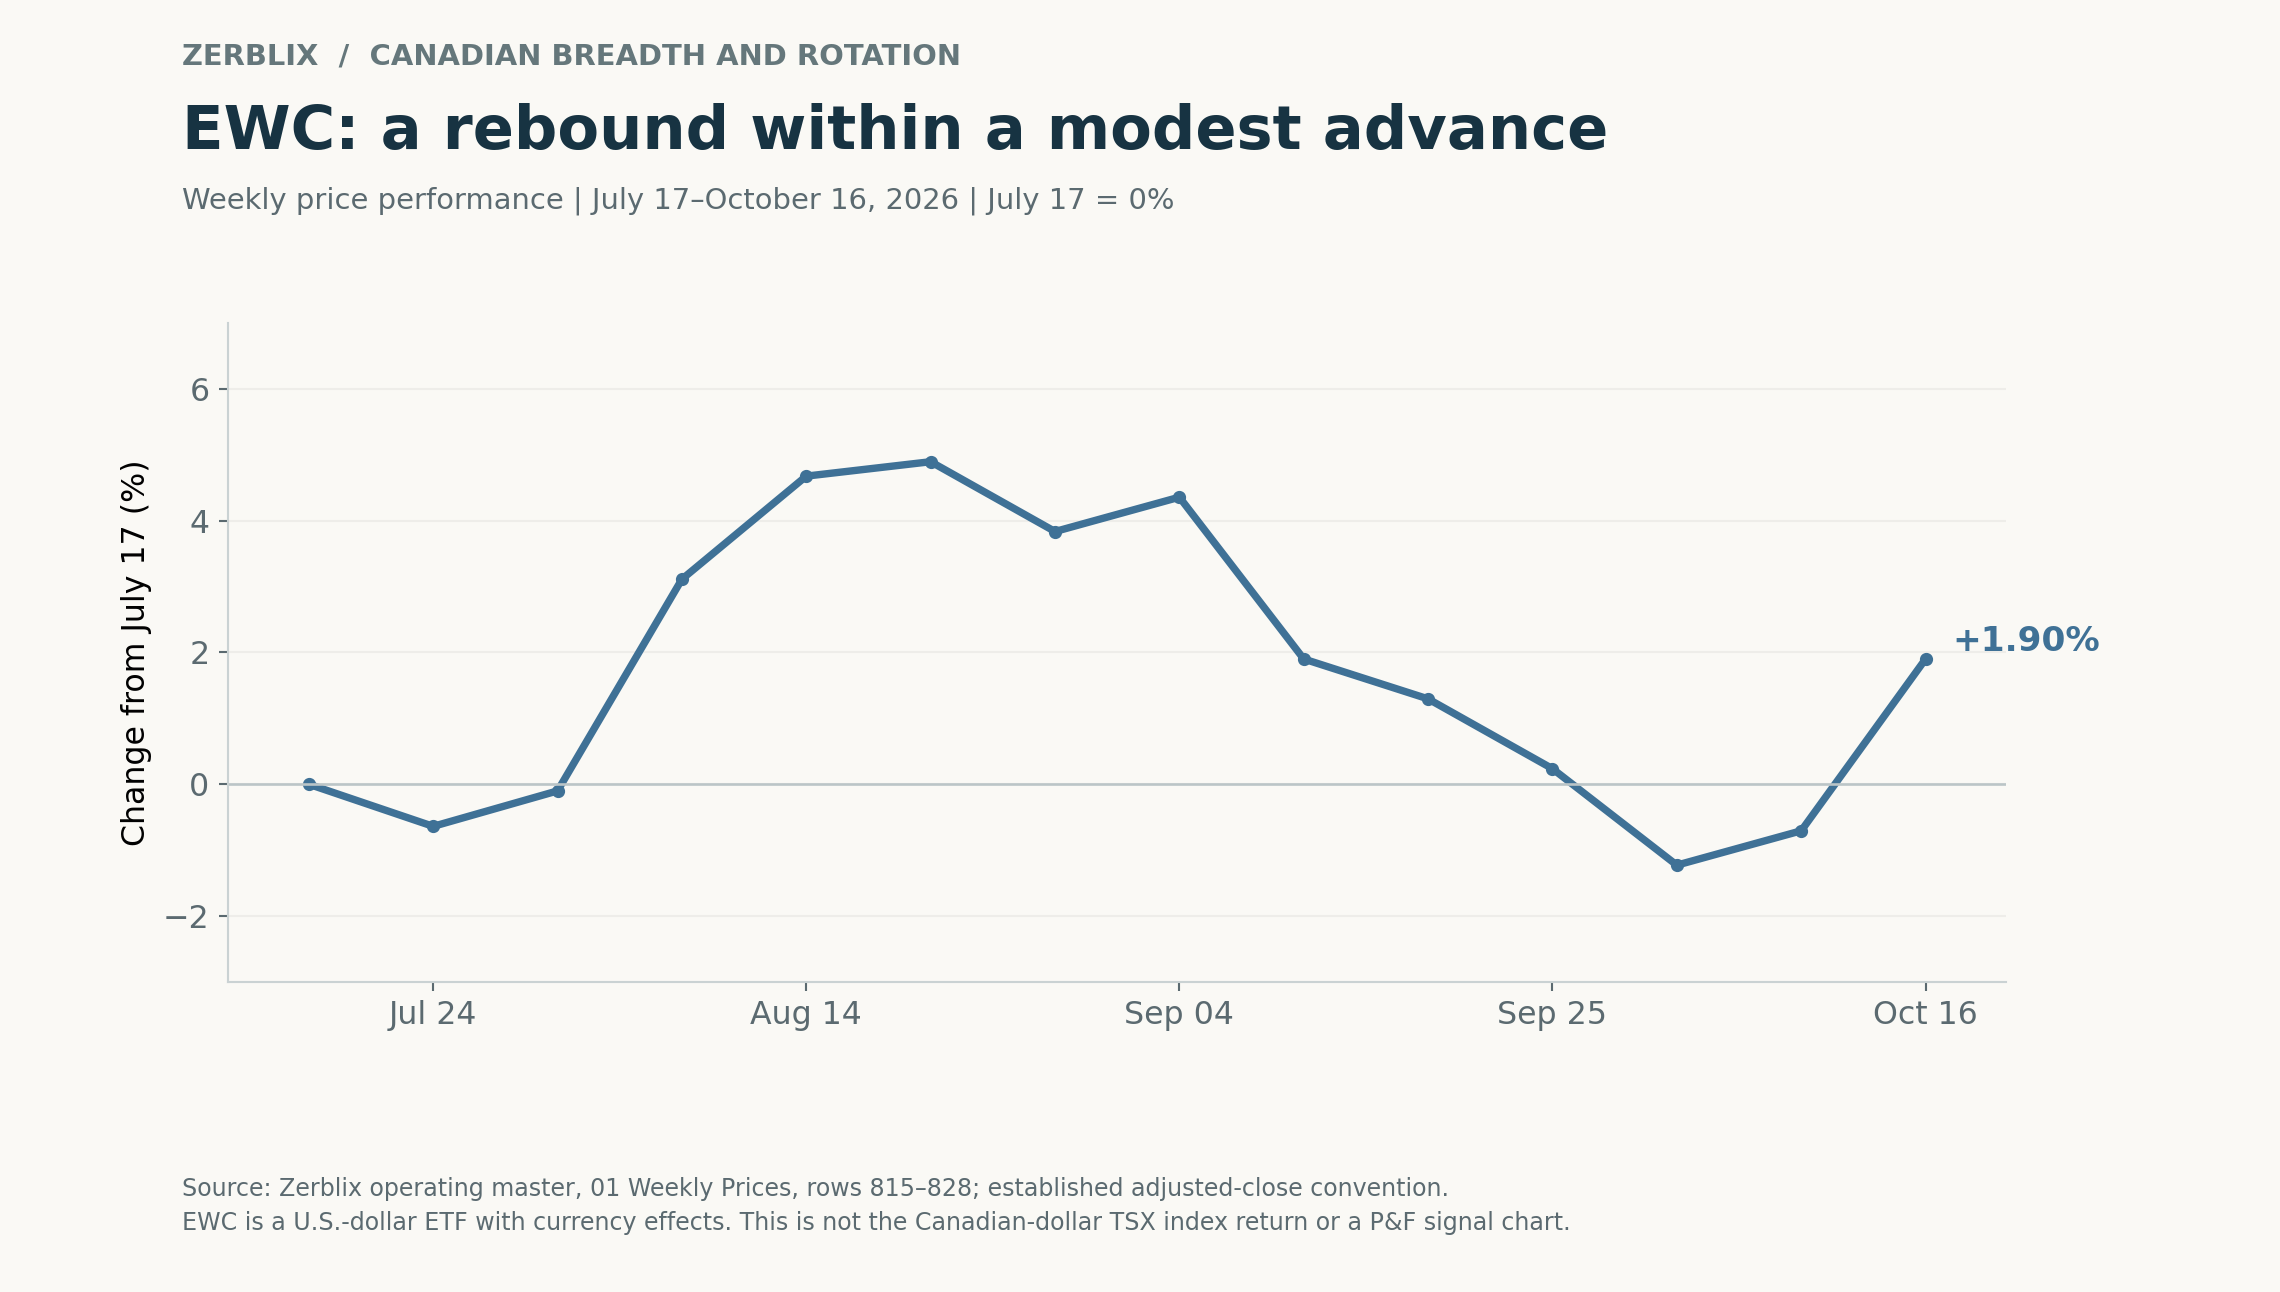
EWC advanced earlier in the 13-week period, surrendered much of that progress, and then rebounded into October 16.
Its returns distinguish the latest recovery from the longer record:
October 9–16: +2.63%.
September 18–October 16: +0.60%.
July 17–October 16: +1.90%.
The latest advance repaired part of the preceding decline, while net progress remained modest across the four-week and 13-week comparisons.
EWC supplies U.S.-dollar ETF context, including currency effects. Commodity prices and relative interest rates can influence the Canadian dollar, adding another layer between Canadian equity performance and a U.S.-dollar investor’s experience. (Bank of Canada) The graph does not isolate that currency contribution or establish a P&F signal state.
What would strengthen the recovery?
Rising-column participation holds its improvement and expands.
BPI rebuilds alongside column direction.
Fresh bullish signals survive subsequent reactions.
Leadership extends across additional groups.
Renewed contraction in X-columns, erosion in Bullish Percent Index (BPI) and failed breakouts would weaken the recovery case.
The Canadian evidence supports a recovery attempt with improving Friday signal flow and identifiable energy strength. Broader buy-signal participation and sustained follow-through remain the next tests.
Source: Zerblix operating workbook. Breadth covers five Official Friday observations from September 18 through October 16. EWC covers fourteen weekly observations spanning thirteen weeks. Fresh-signal counts reflect traditional three-box reversal scans for the specified Friday sessions. Macro context is separately sourced from the Bank of Canada.Past performance does not guarantee future results. Investing involves risk, including loss of principal.